Free Paid Media Dashboard & Report Templates
Compare campaign results, monitor budget pacing, analyze creative performance, and report on paid media KPIs without starting from a blank dashboard or spreadsheet.
Browse Paid media templates
Preview the report, review its included fields, and choose the Data Studio dashboard or Google Sheets workflow that matches your reporting needs.
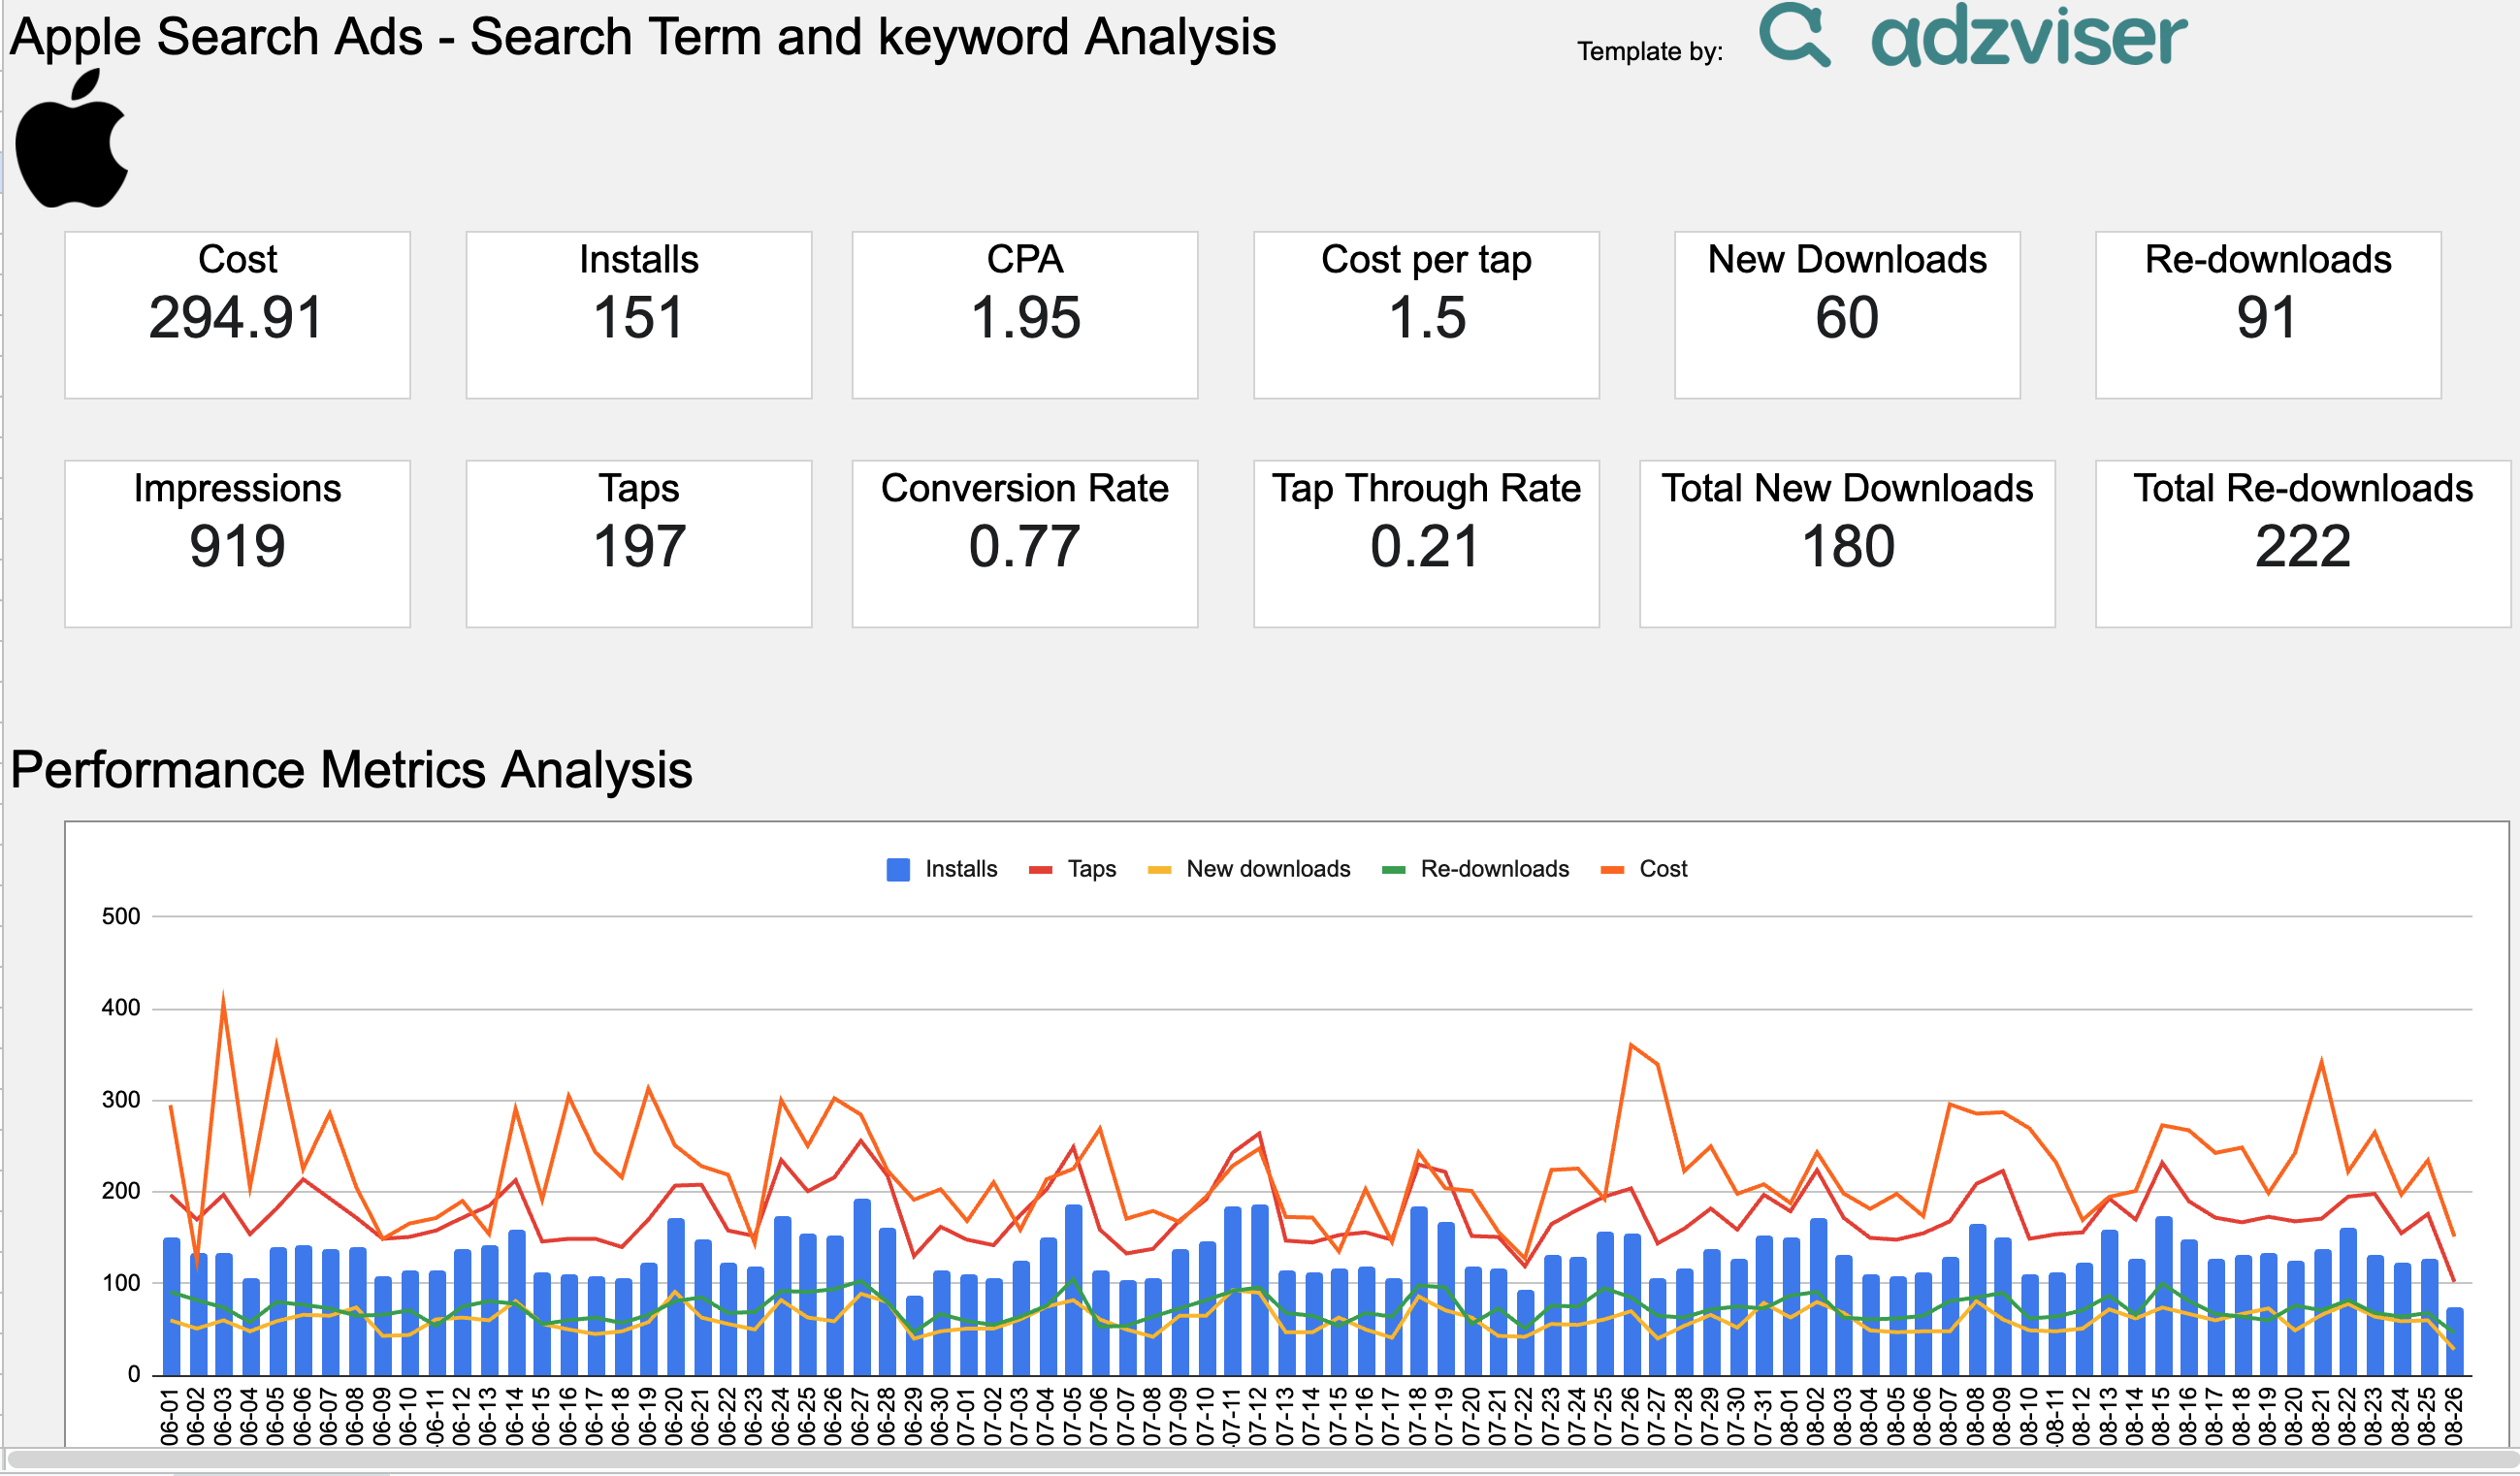


Apple Ads Search Term and Keyword Analysis
An Apple Search Ads keyword and search term analysis report for Google Sheets — track cost, taps, impressions, CPA, conversion rate, and installs/downloads at a glance, with a daily performance trend chart broken down by campaign, keyword, and search term.
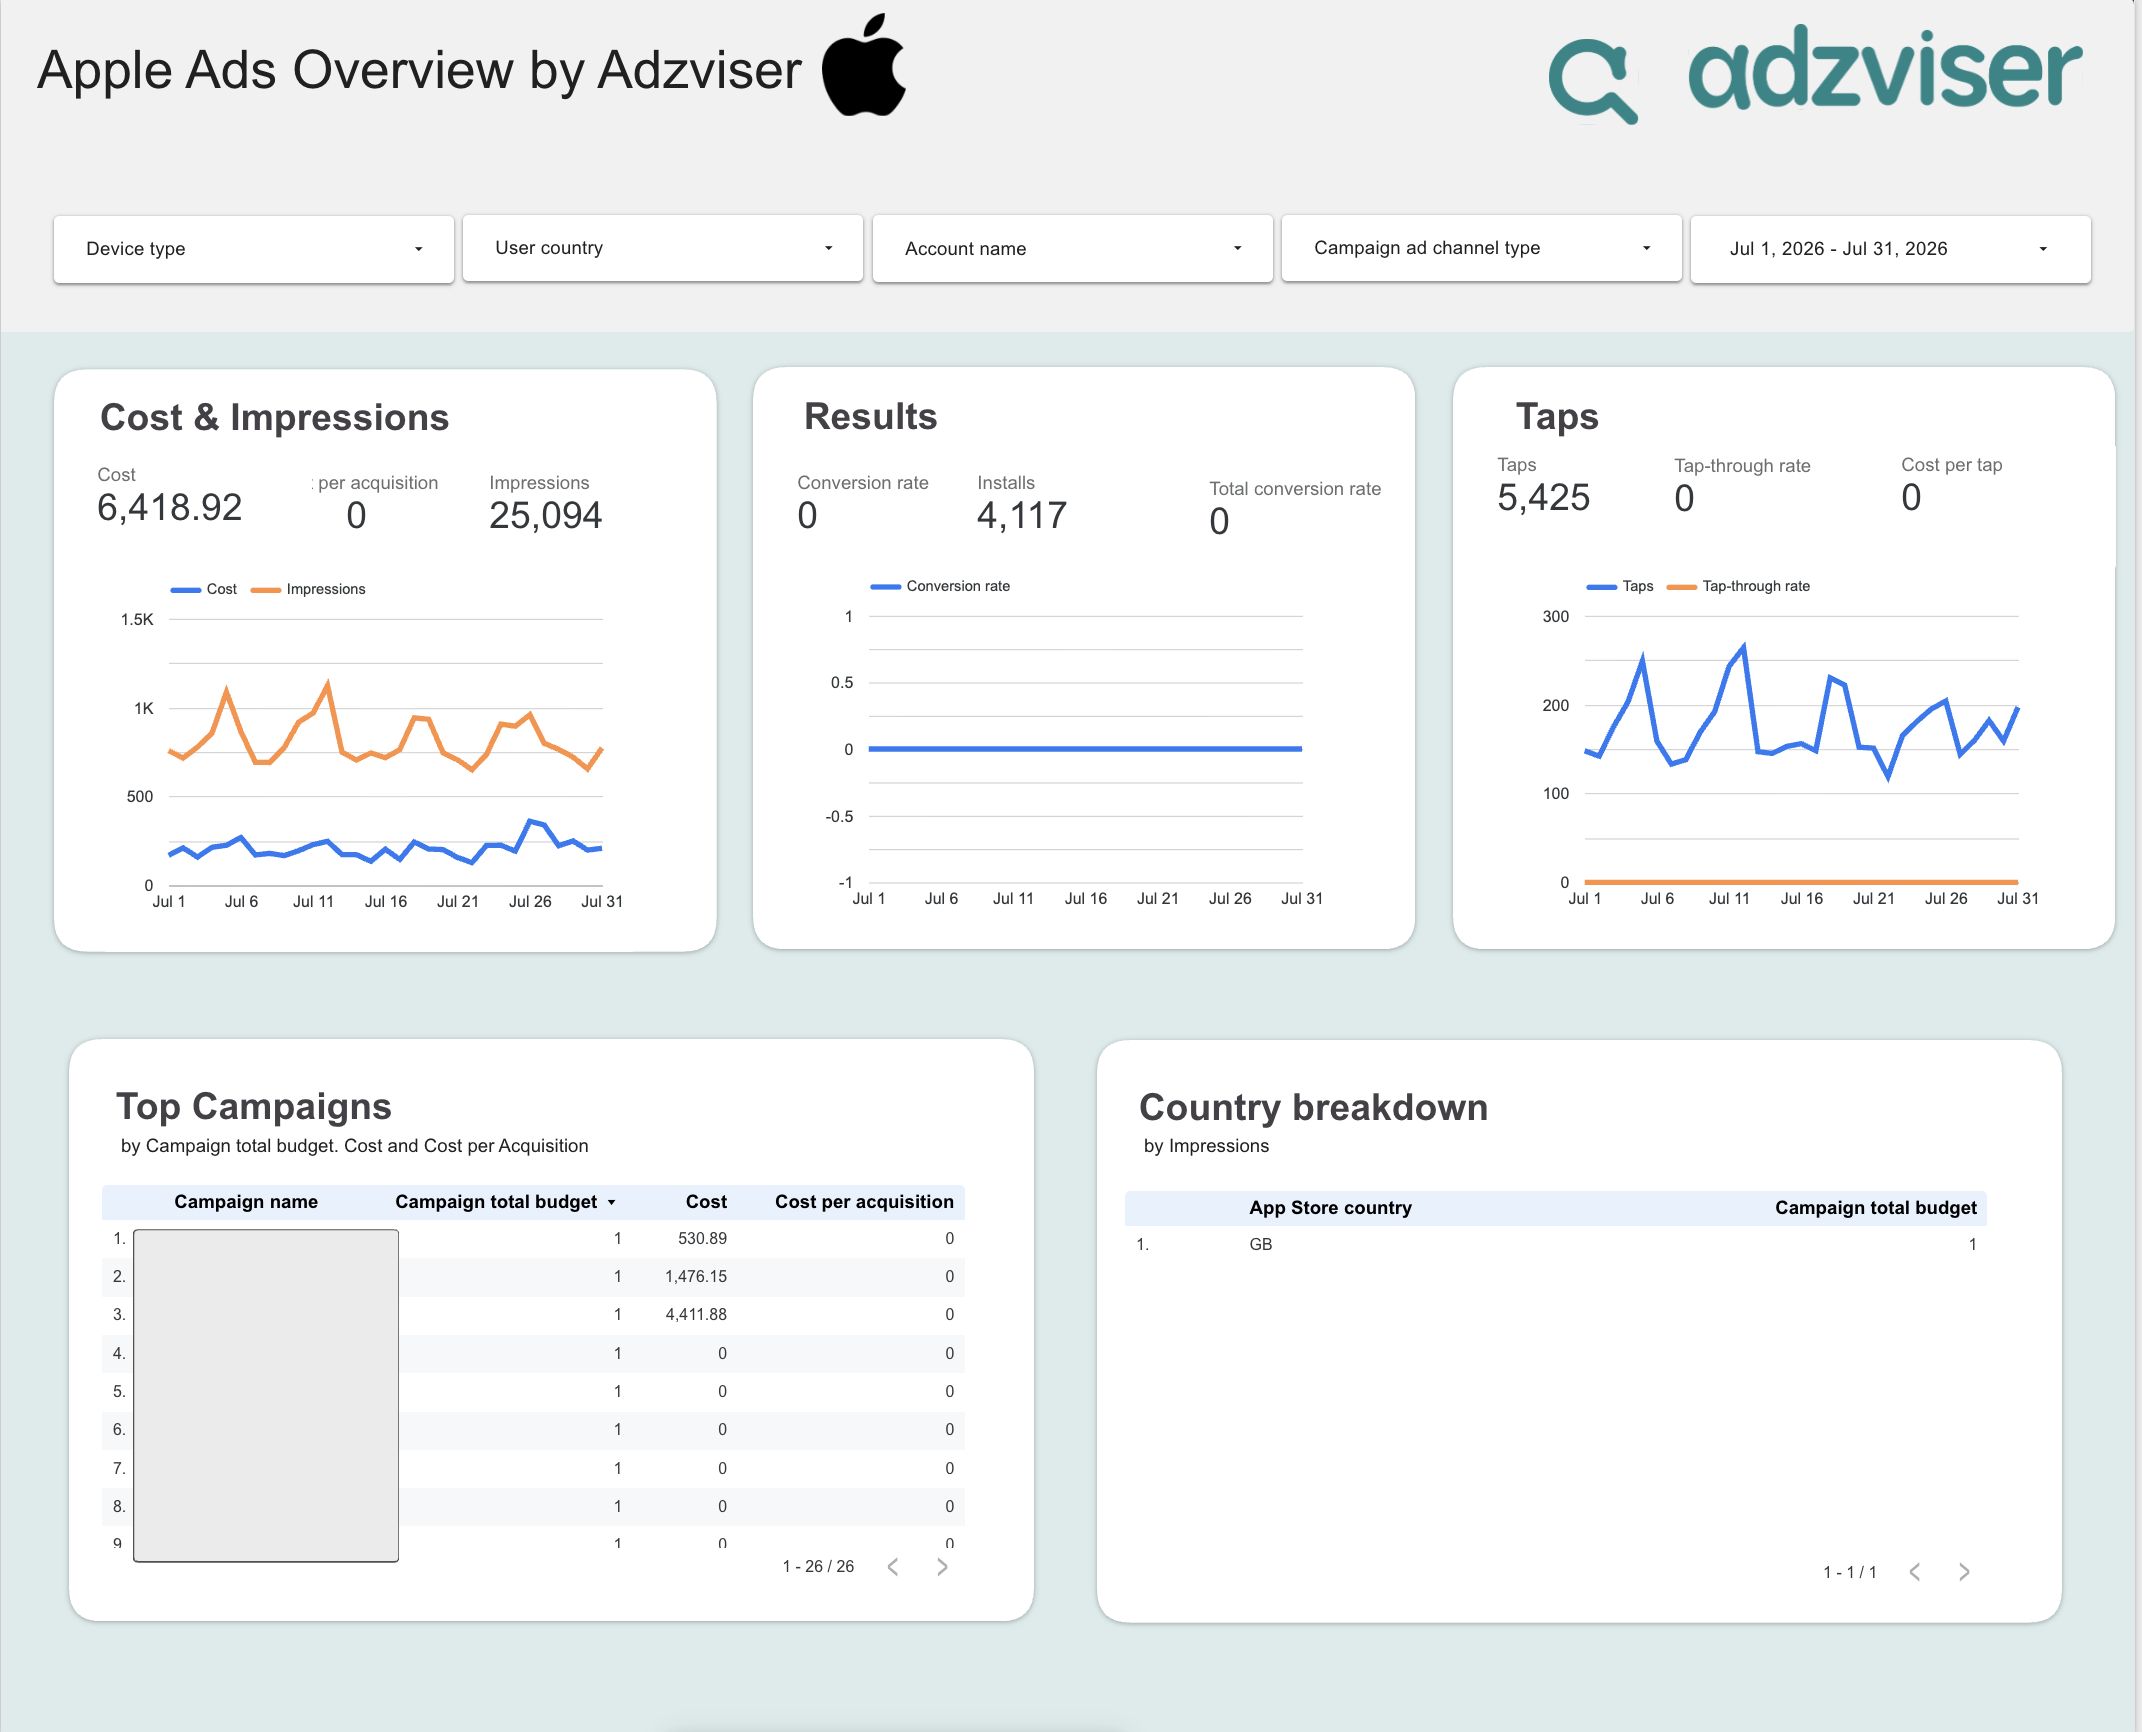

Apple Ads Overview
A two-page Apple Ads dashboard for Data Studio — an overview page tracking cost, impressions, taps, installs, and conversion rate with top-campaigns and country tables, plus a breakdown page by device, age, gender, and campaign objective.
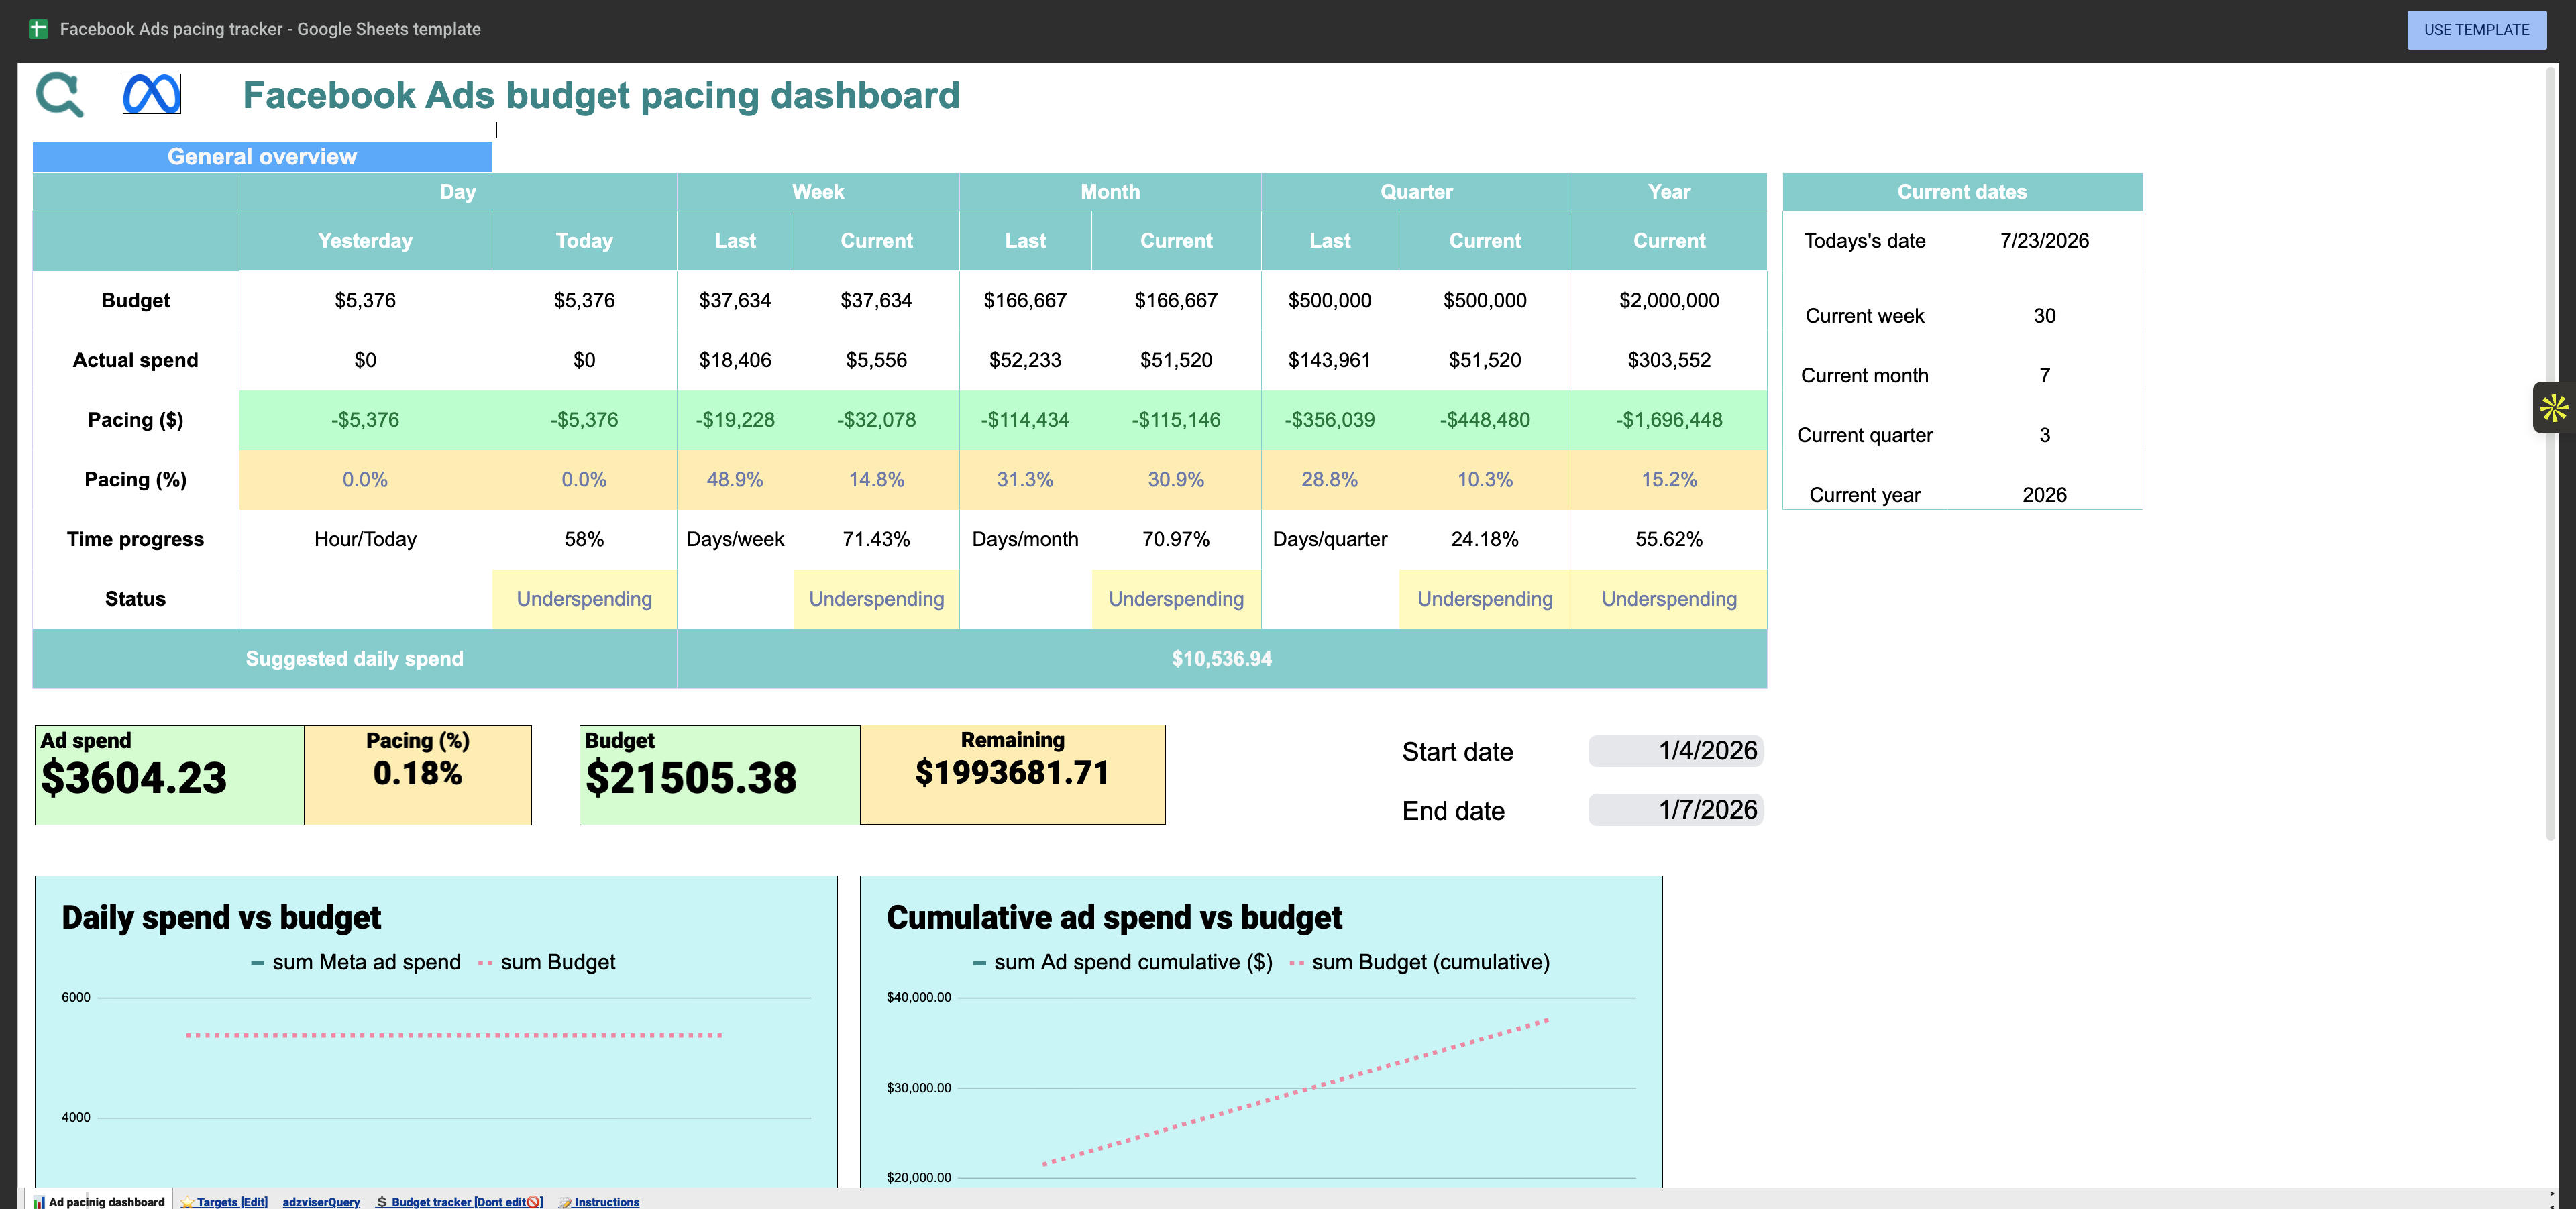

Facebook Ads Budget Tracking & Pacing Dashboard
Monitor budget pacing across your Facebook Ads campaigns — track spend to date against target budget so you never over- or under-spend.
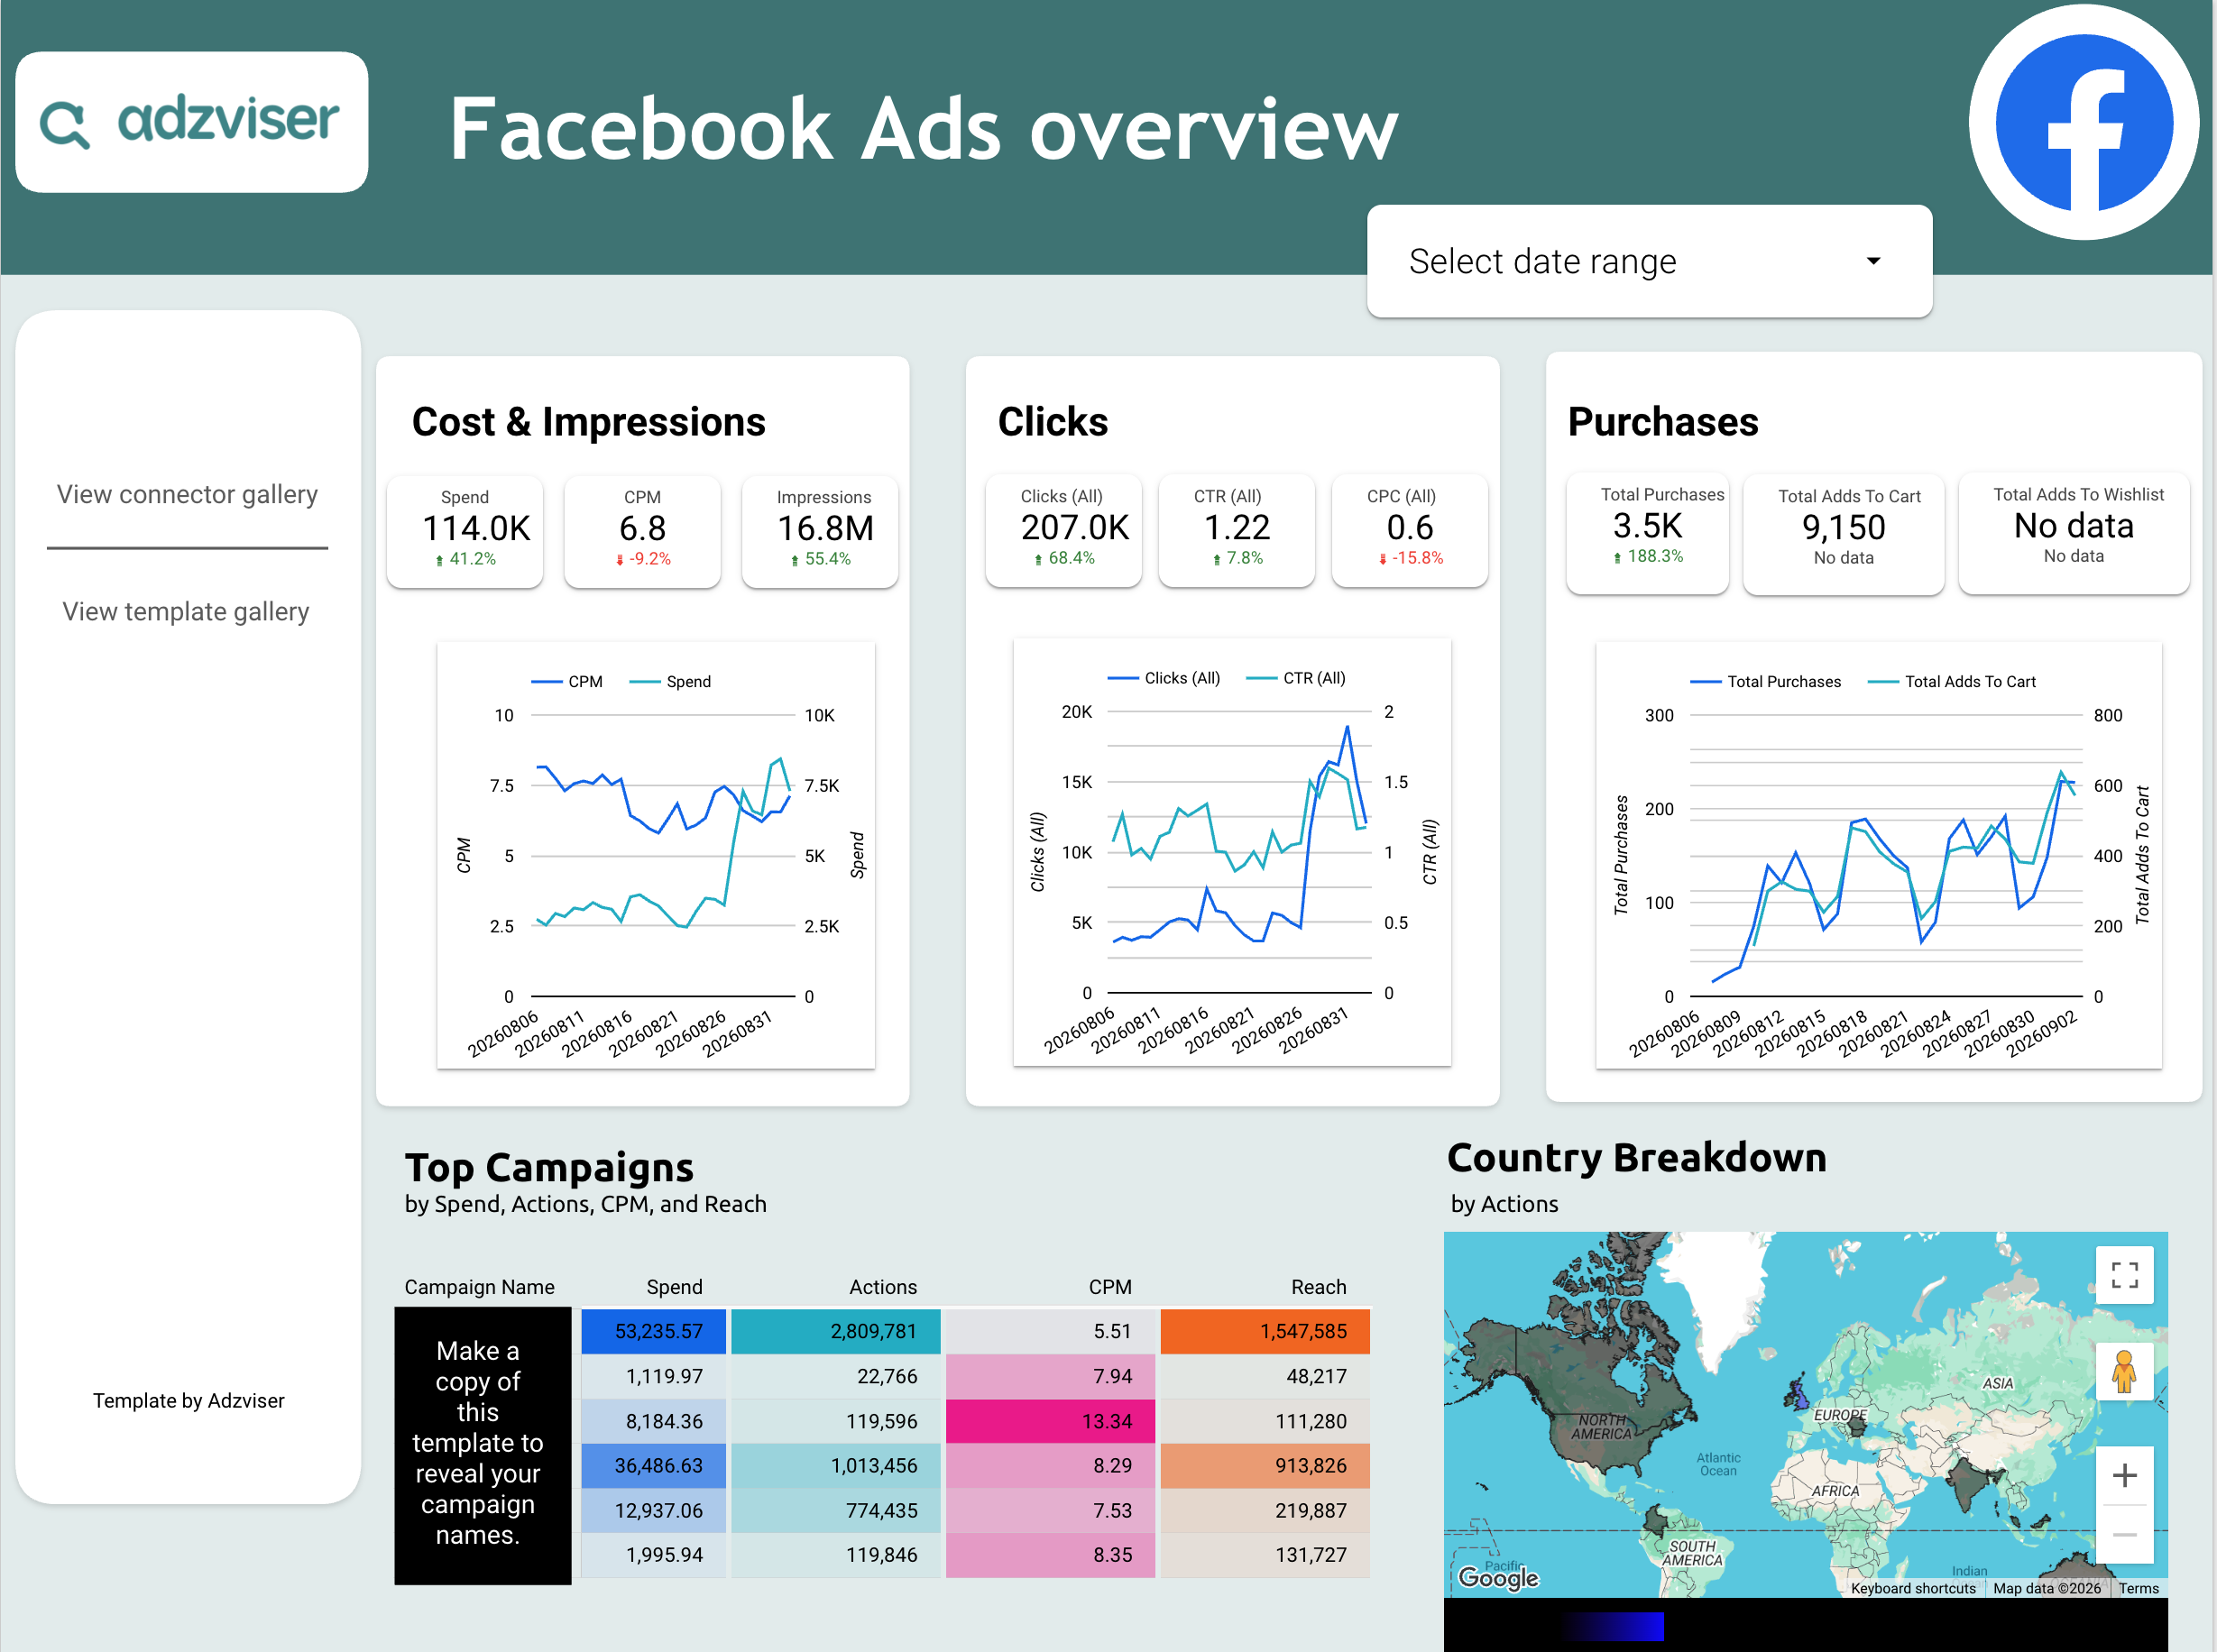
Facebook Ads Dashboard
A two-page Facebook Ads dashboard for Data Studio — an overview page showing spend, CPM, impressions, clicks, and purchases with trend charts, a top-campaigns table, and a country breakdown by actions, plus a breakdown page by device platform, age, gender, and campaign objective.
Facebook Ads Monthly Report Template
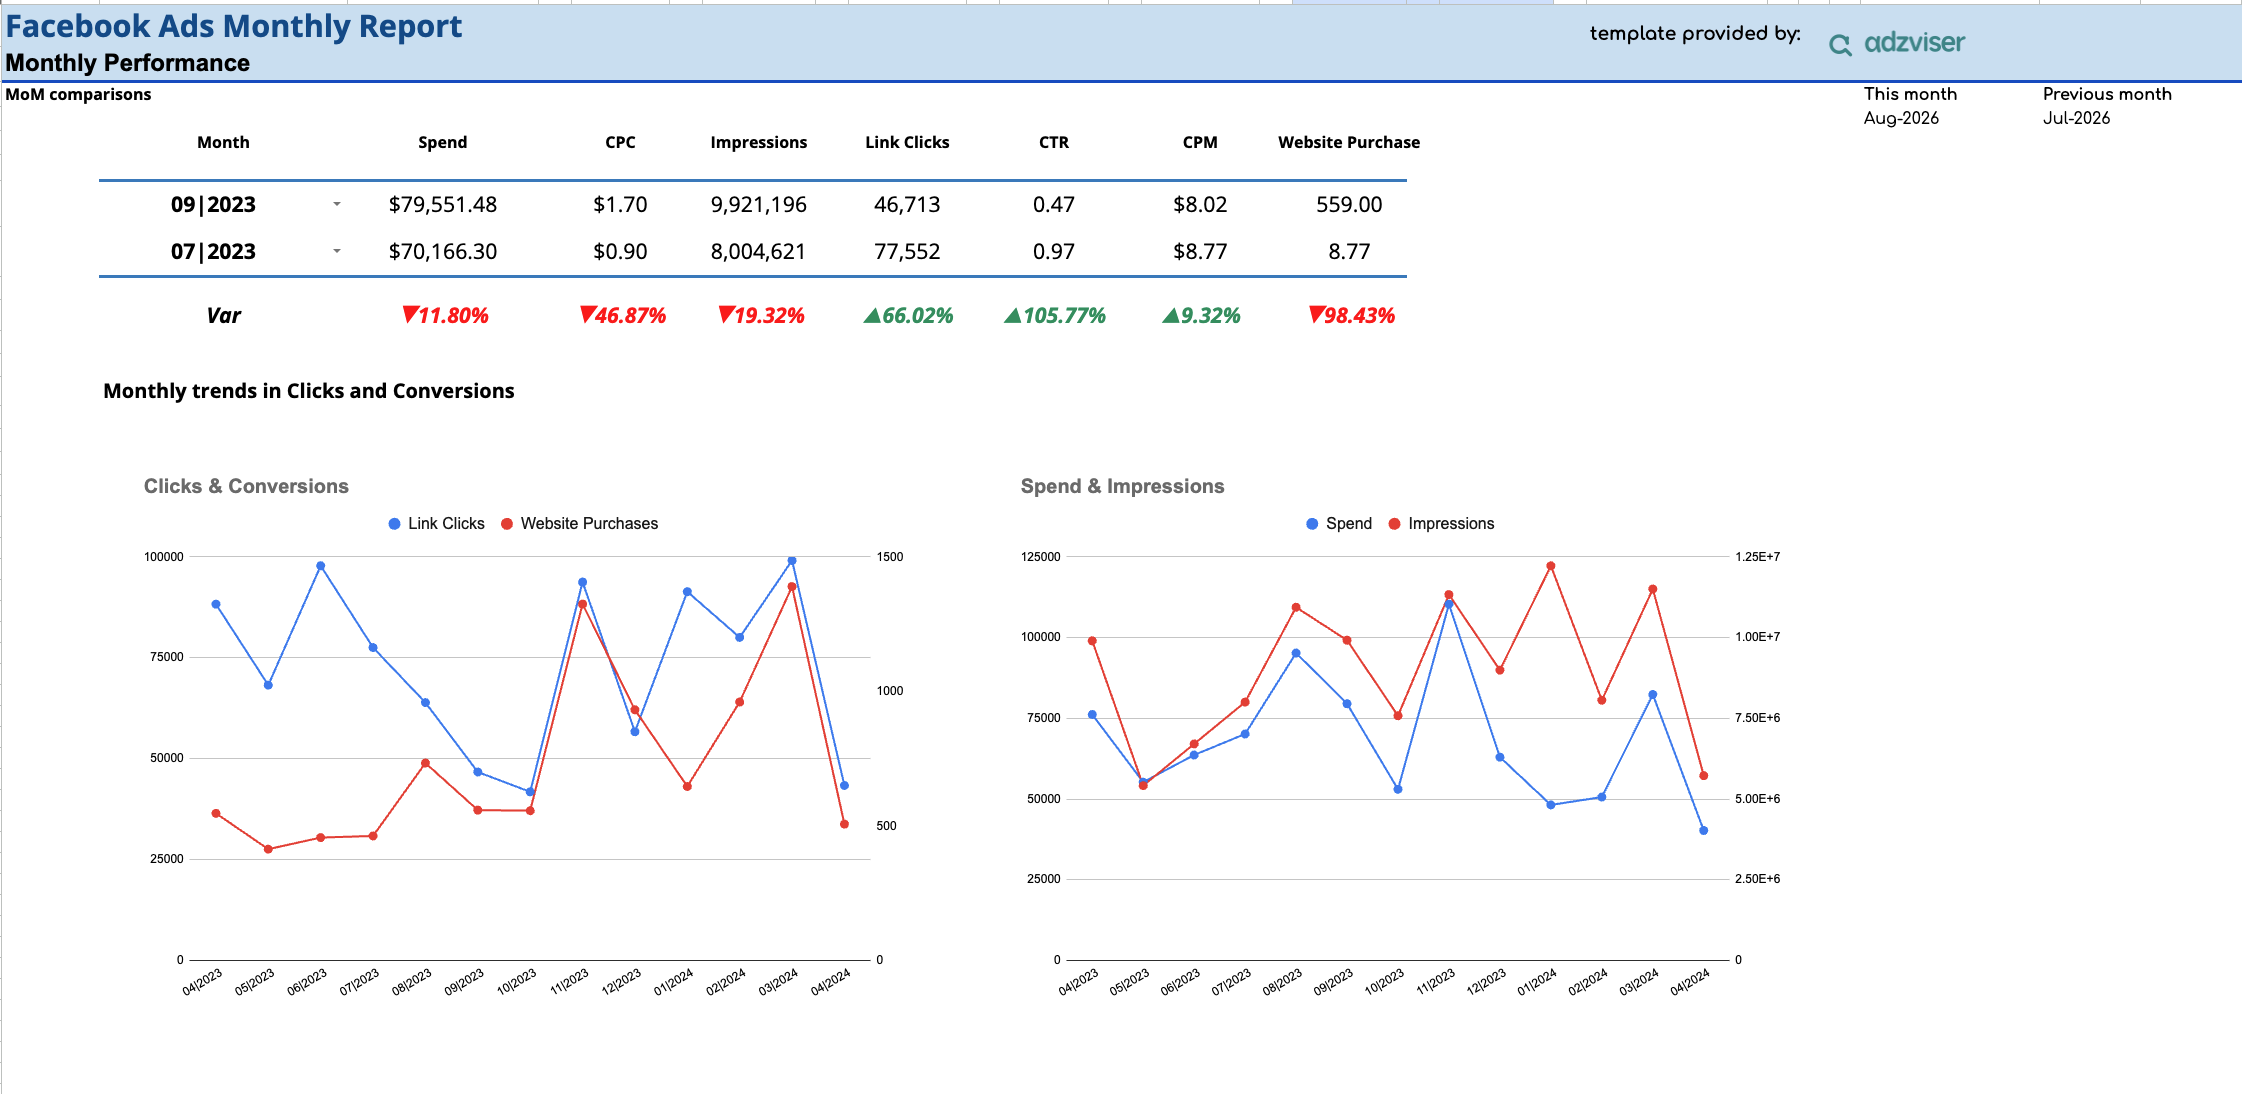
A Facebook Ads monthly performance report for Google Sheets — compare spend, CPC, impressions, link clicks, CTR, CPM, and website purchases month-over-month, with trend charts and breakdowns by campaign, device, and demographics.
Facebook Ads Performance Analysis
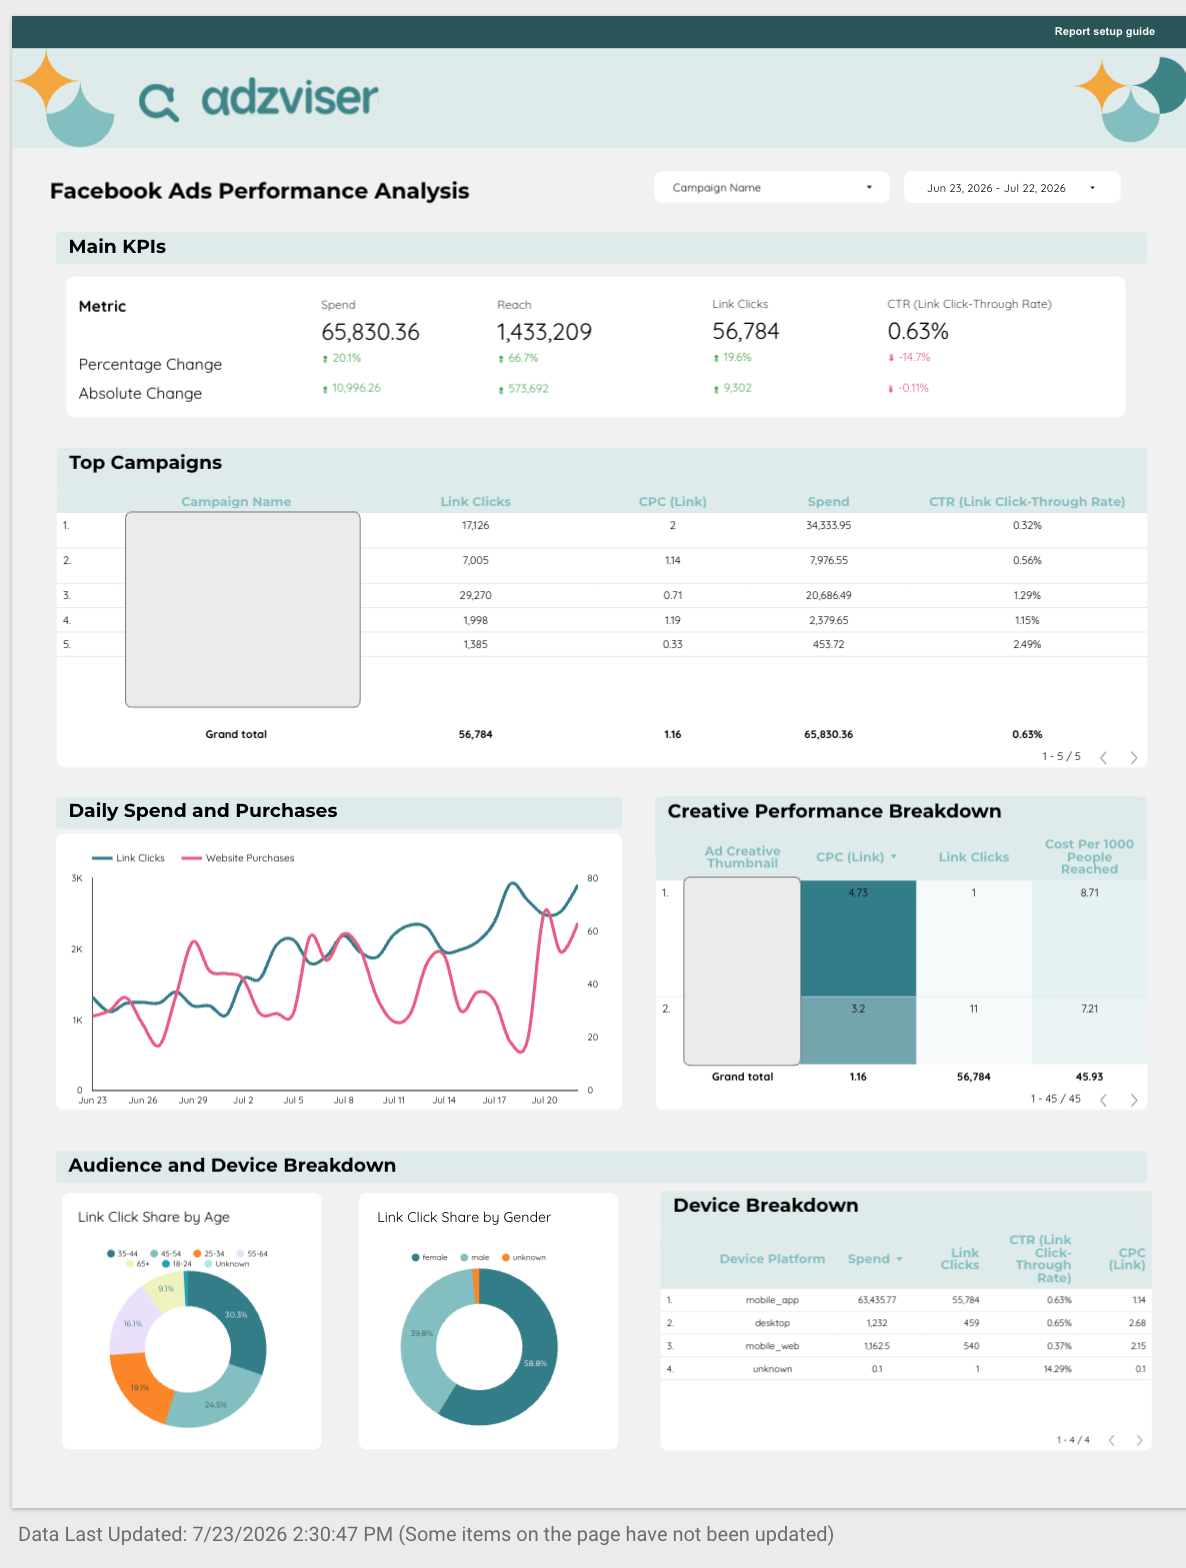
A comprehensive Facebook Ads dashboard for Data Studio — track spend, reach, link clicks, and CTR alongside top campaigns, creative performance, and audience & device breakdowns.
Facebook Ads Weekly Campaign Performance
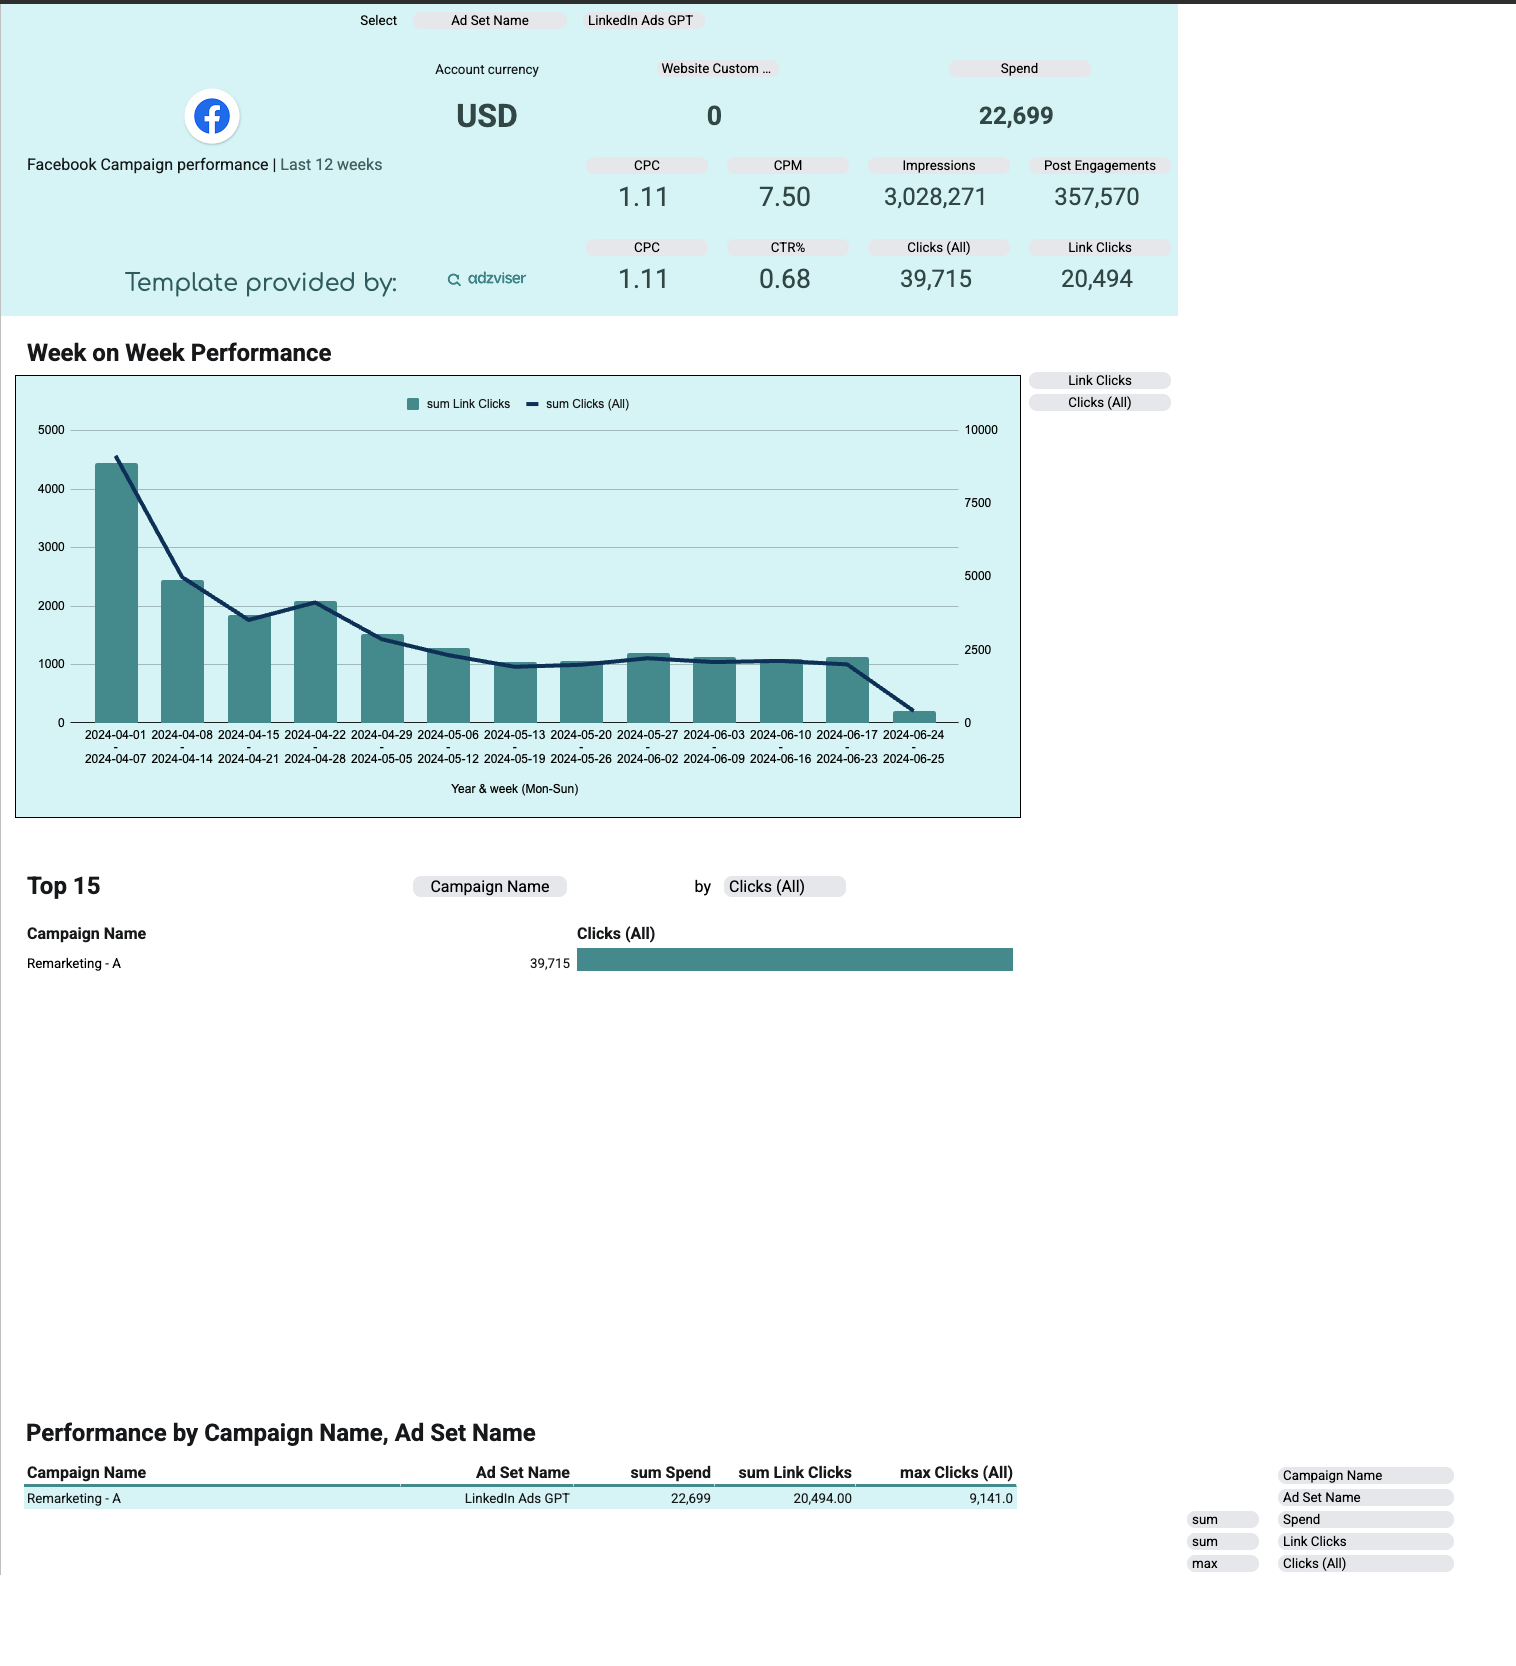
A Facebook Ads weekly campaign performance report for Google Sheets — track spend, CPC, CPM, impressions, post engagements, CTR, and clicks over the last 12 weeks, with a week-on-week trend chart and a top-15 campaign breakdown by ad set.

Google Ads Monthly Report Template
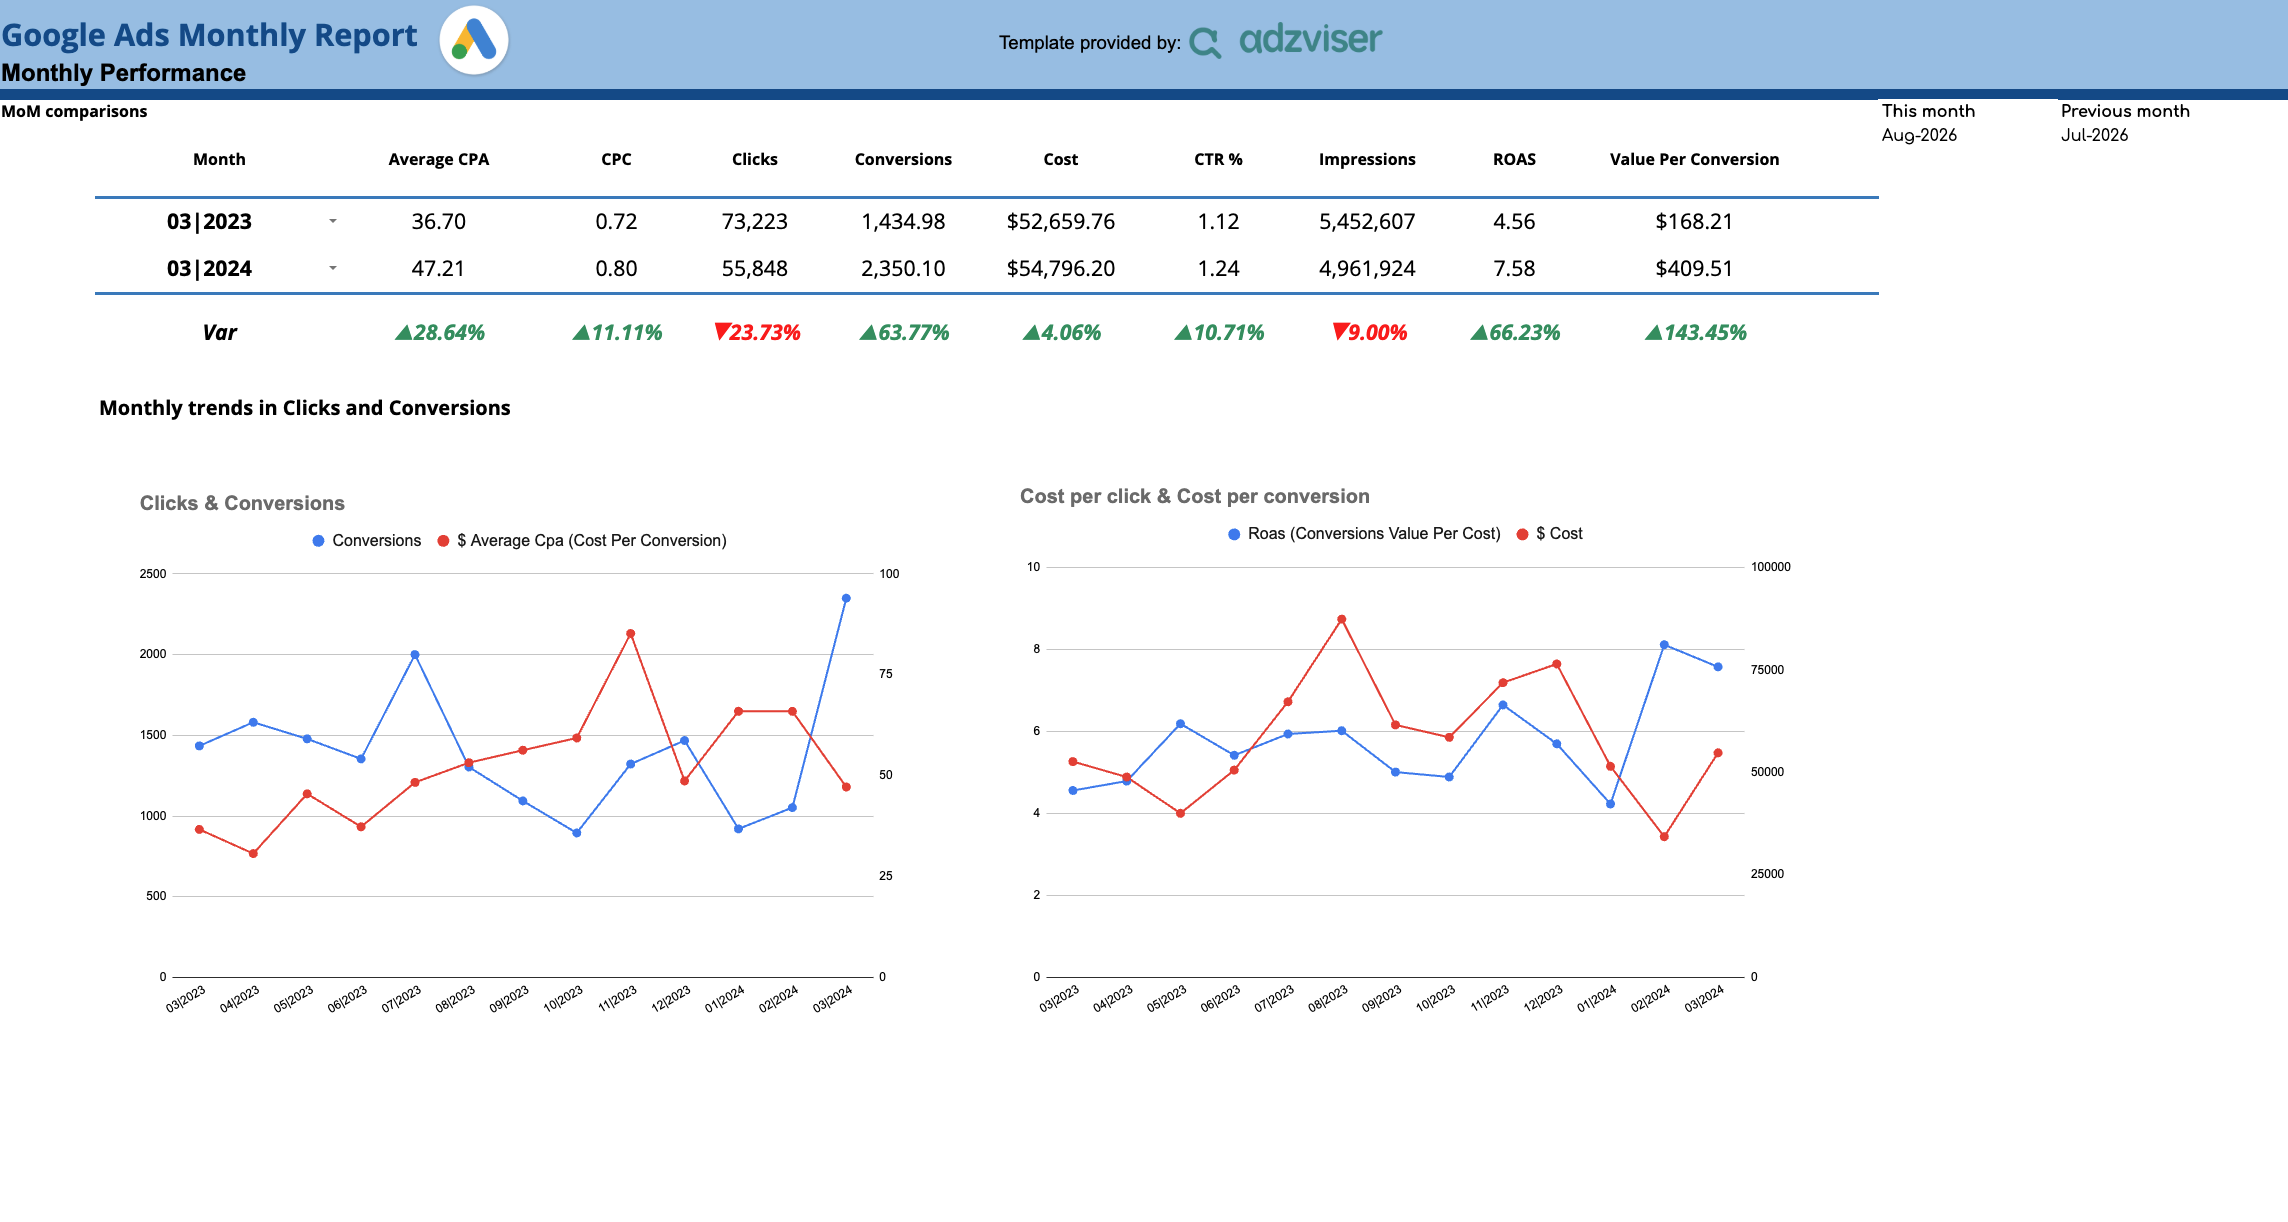
A multi-page Google Ads monthly performance report for Google Sheets — compare CPA, CPC, clicks, conversions, cost, CTR, impressions, and ROAS month-over-month with trend charts, plus dedicated breakdown pages by country, device type, and campaign name.
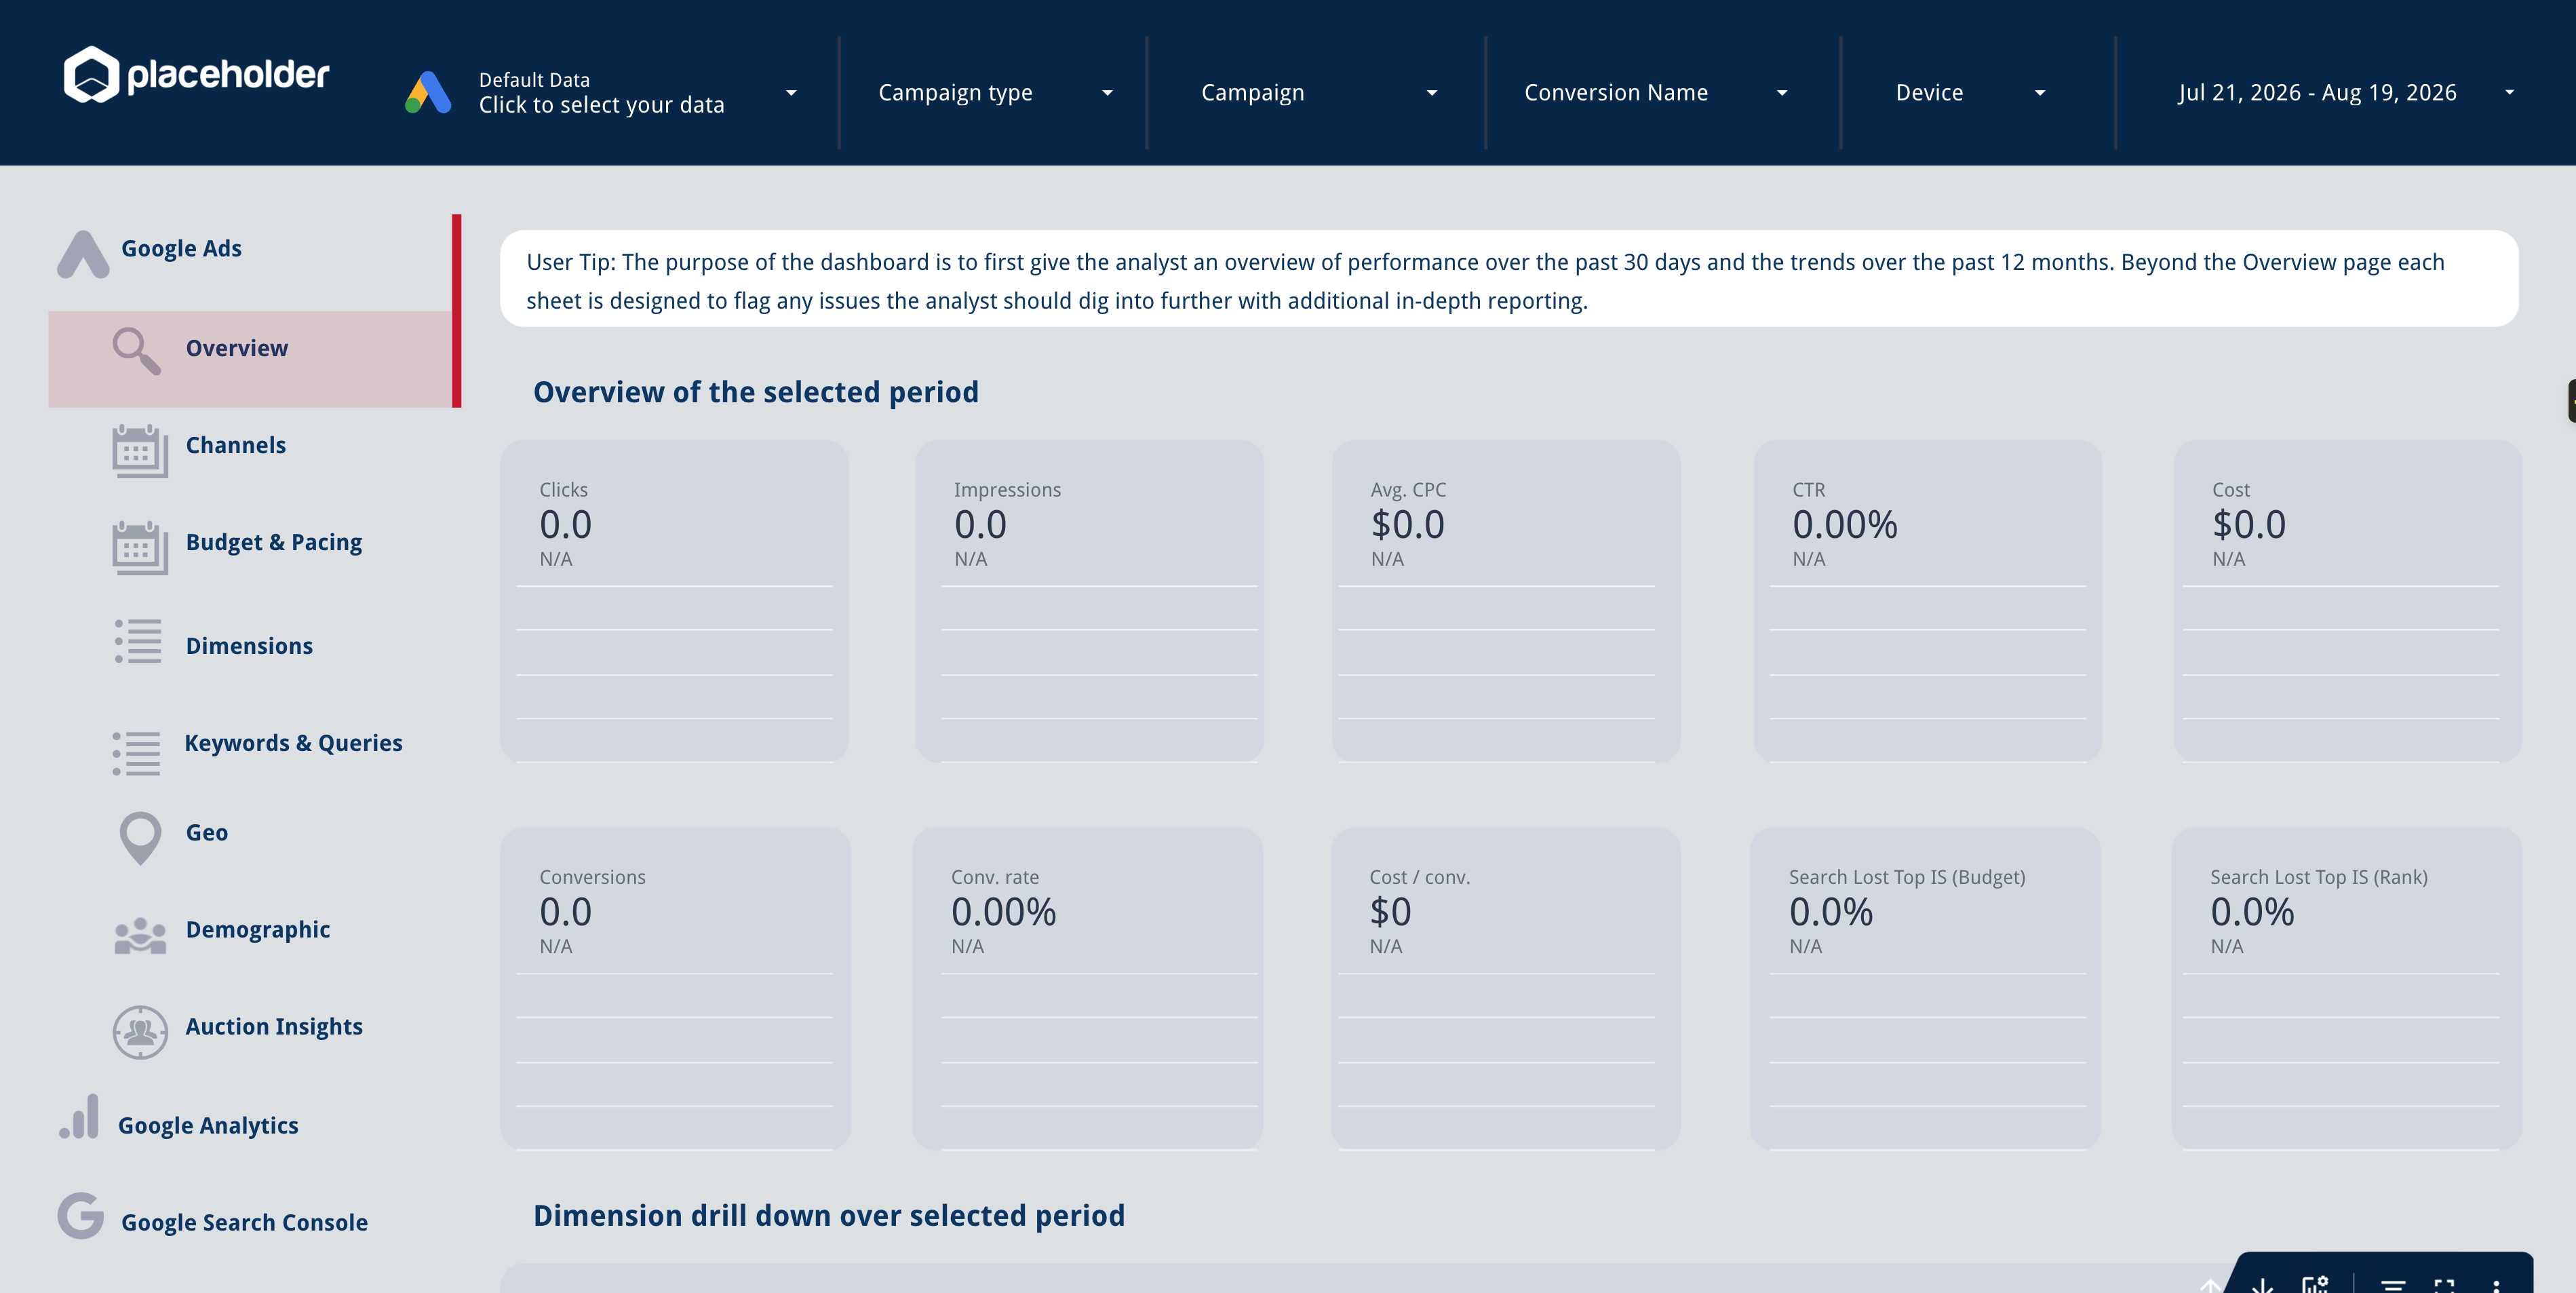
Google Ads Overview
A Google Ads overview dashboard for Data Studio — track clicks, impressions, average CPC, CTR, cost, conversions, and search lost impression share at a glance, with filters by campaign type, campaign, conversion name, and device.
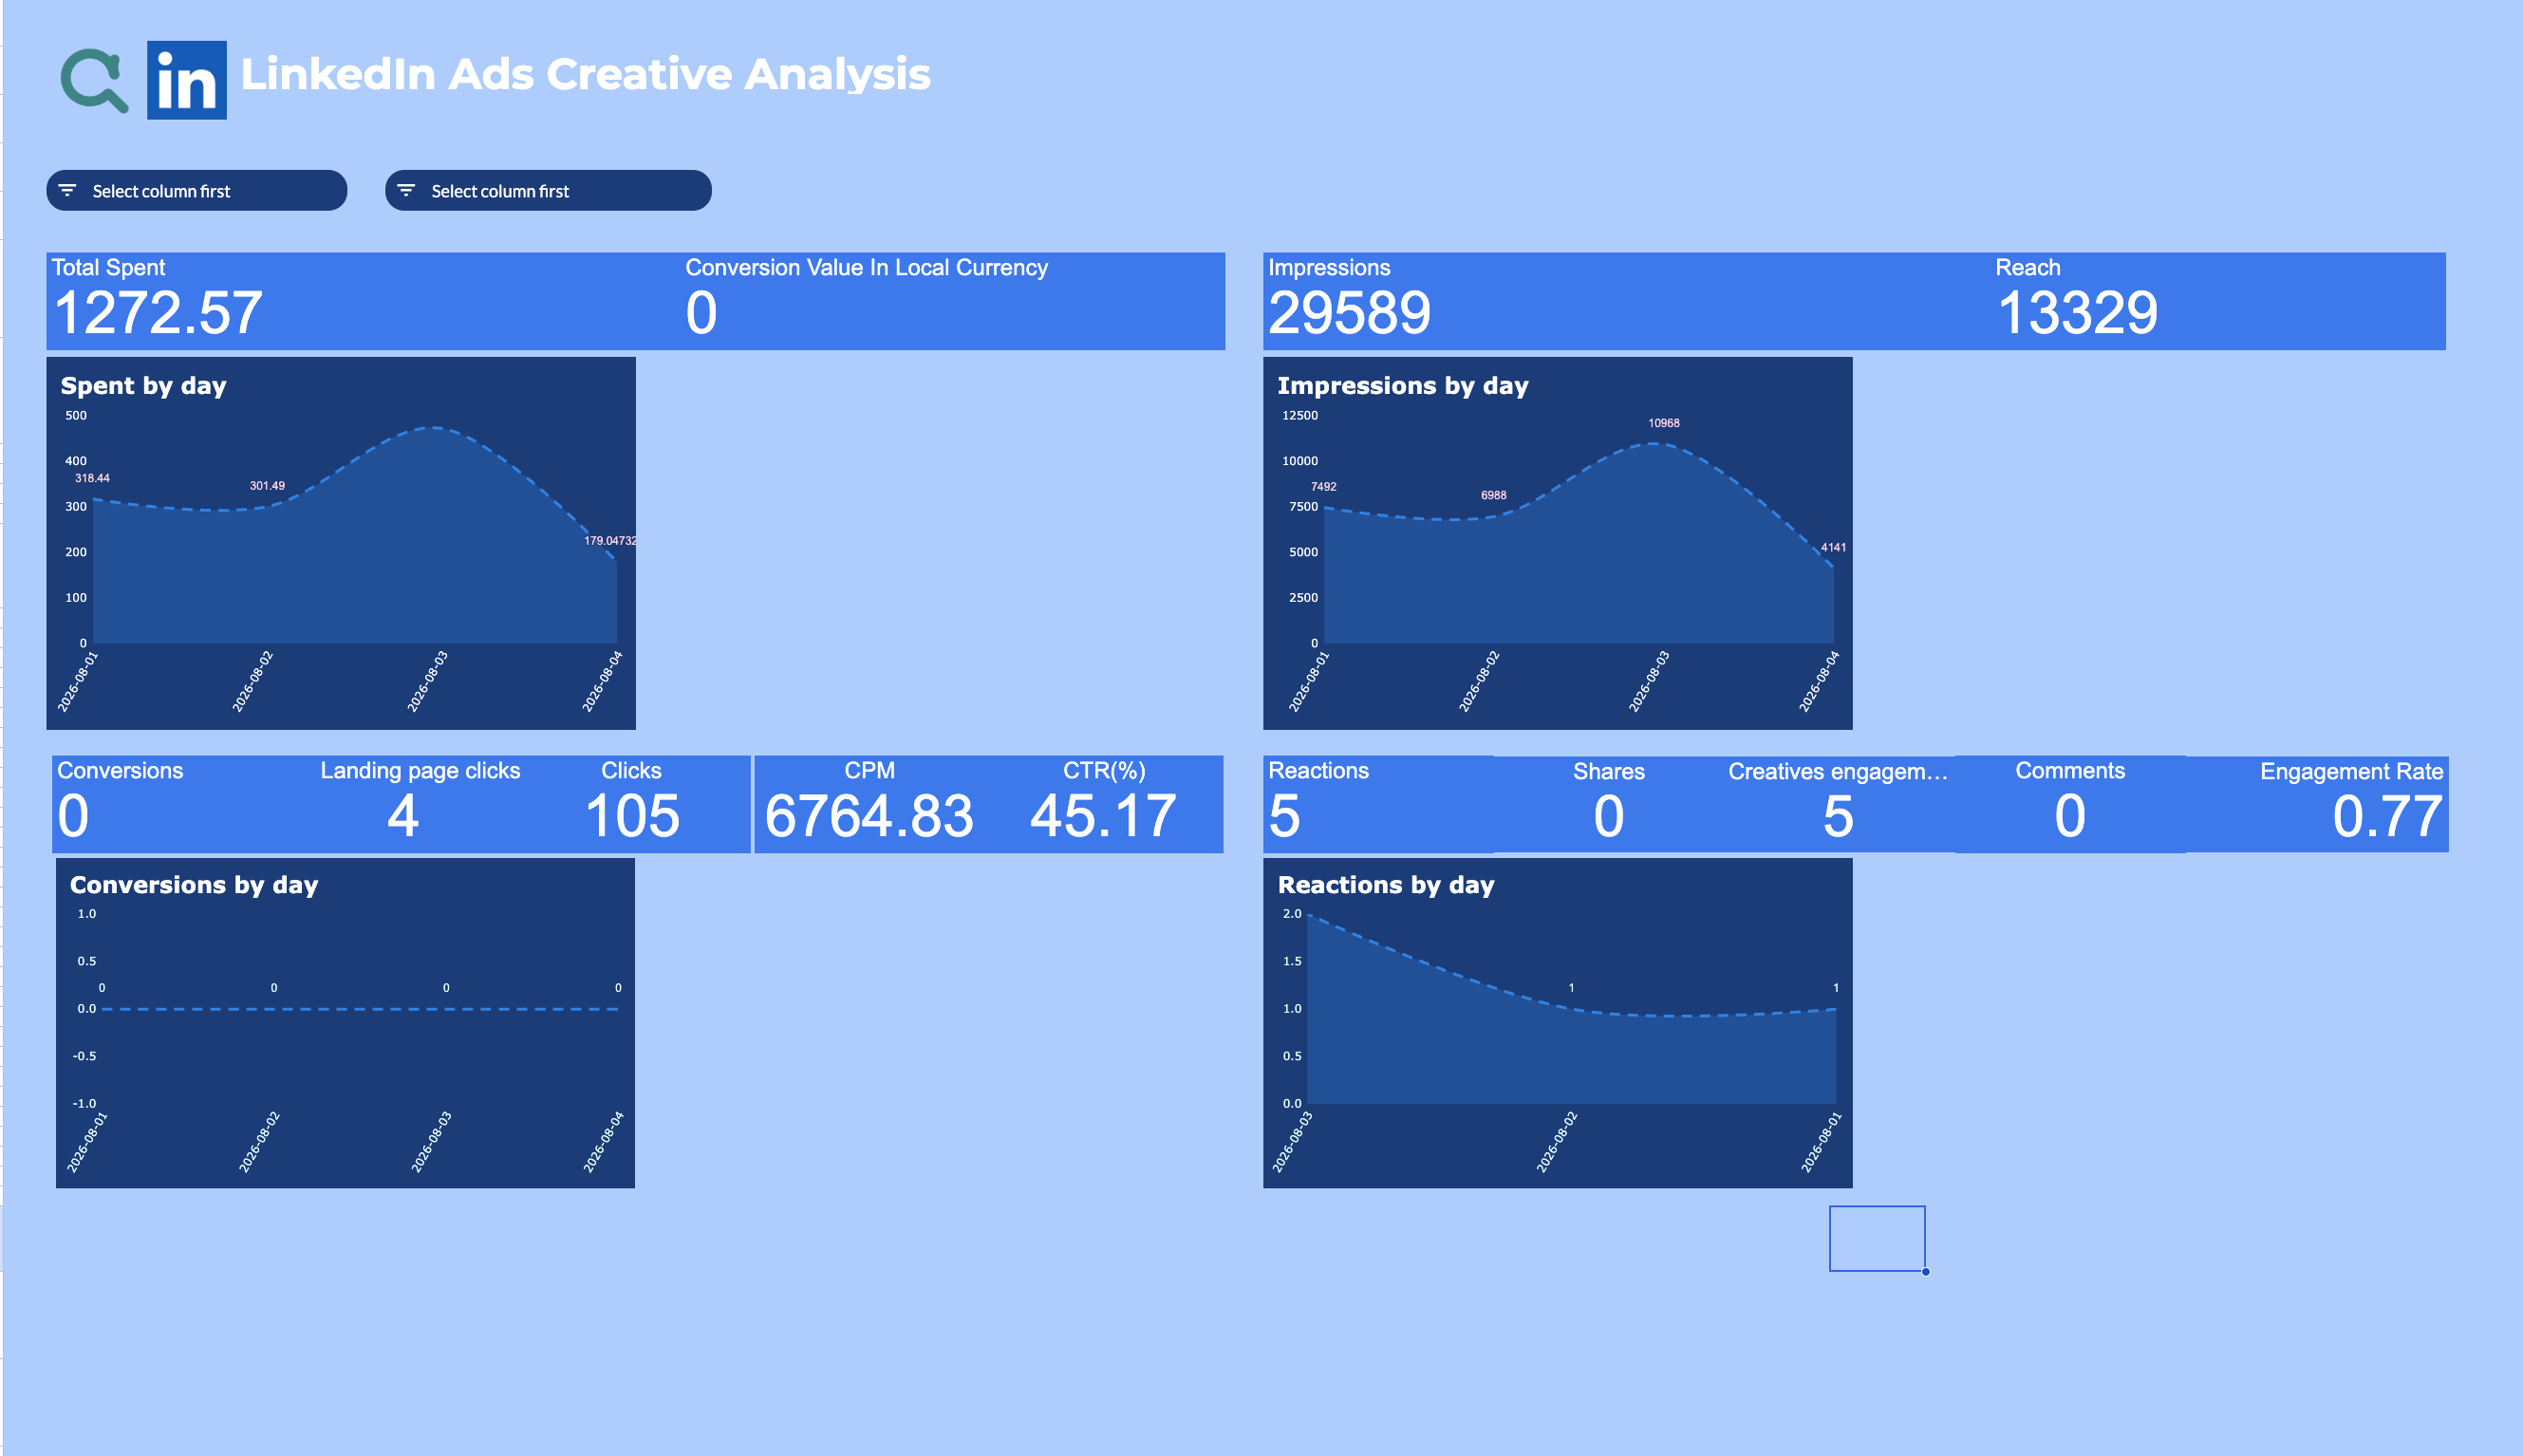

LinkedIn Ads Creative Analysis Report
Analyze how each LinkedIn Ads creative performs — spend, impressions, reach, clicks, CPM, CTR, and engagement (reactions, shares, comments) tracked day by day.
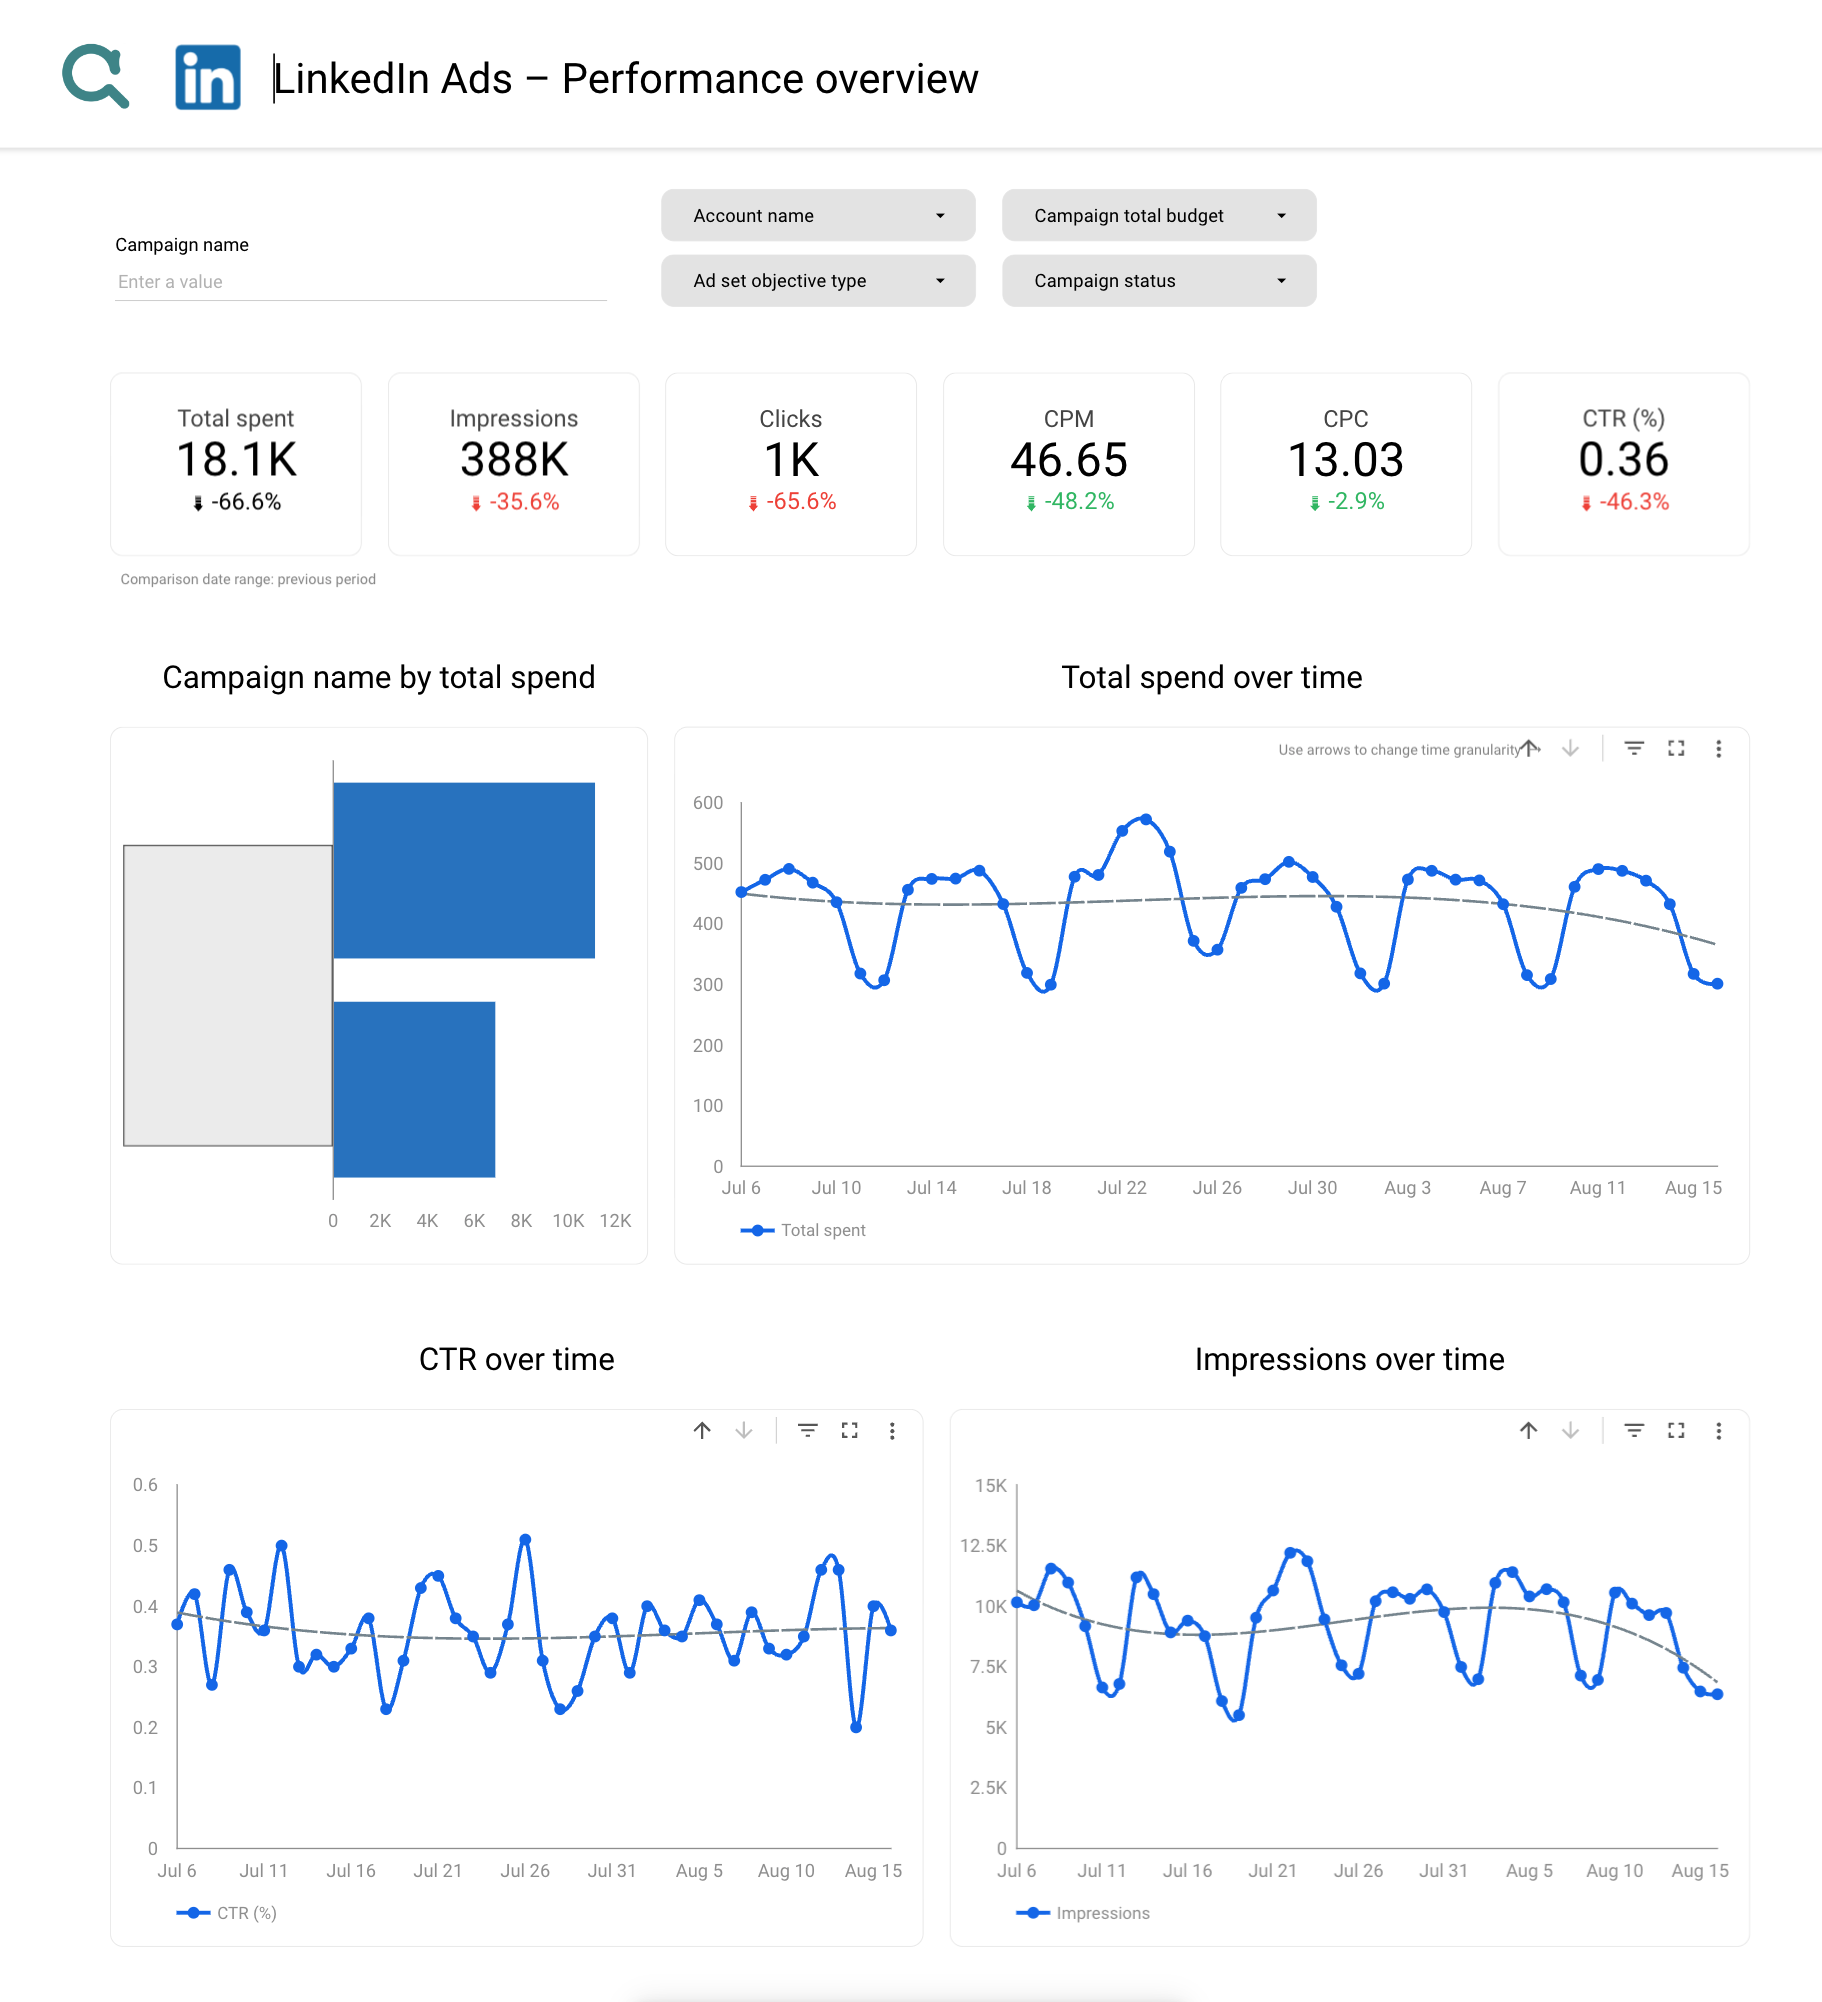
LinkedIn Ads Dashboard
A LinkedIn Ads performance overview for Data Studio — track total spend, impressions, clicks, CPM, CPC, and CTR at a glance, with spend and engagement trend charts and a top-campaigns breakdown.
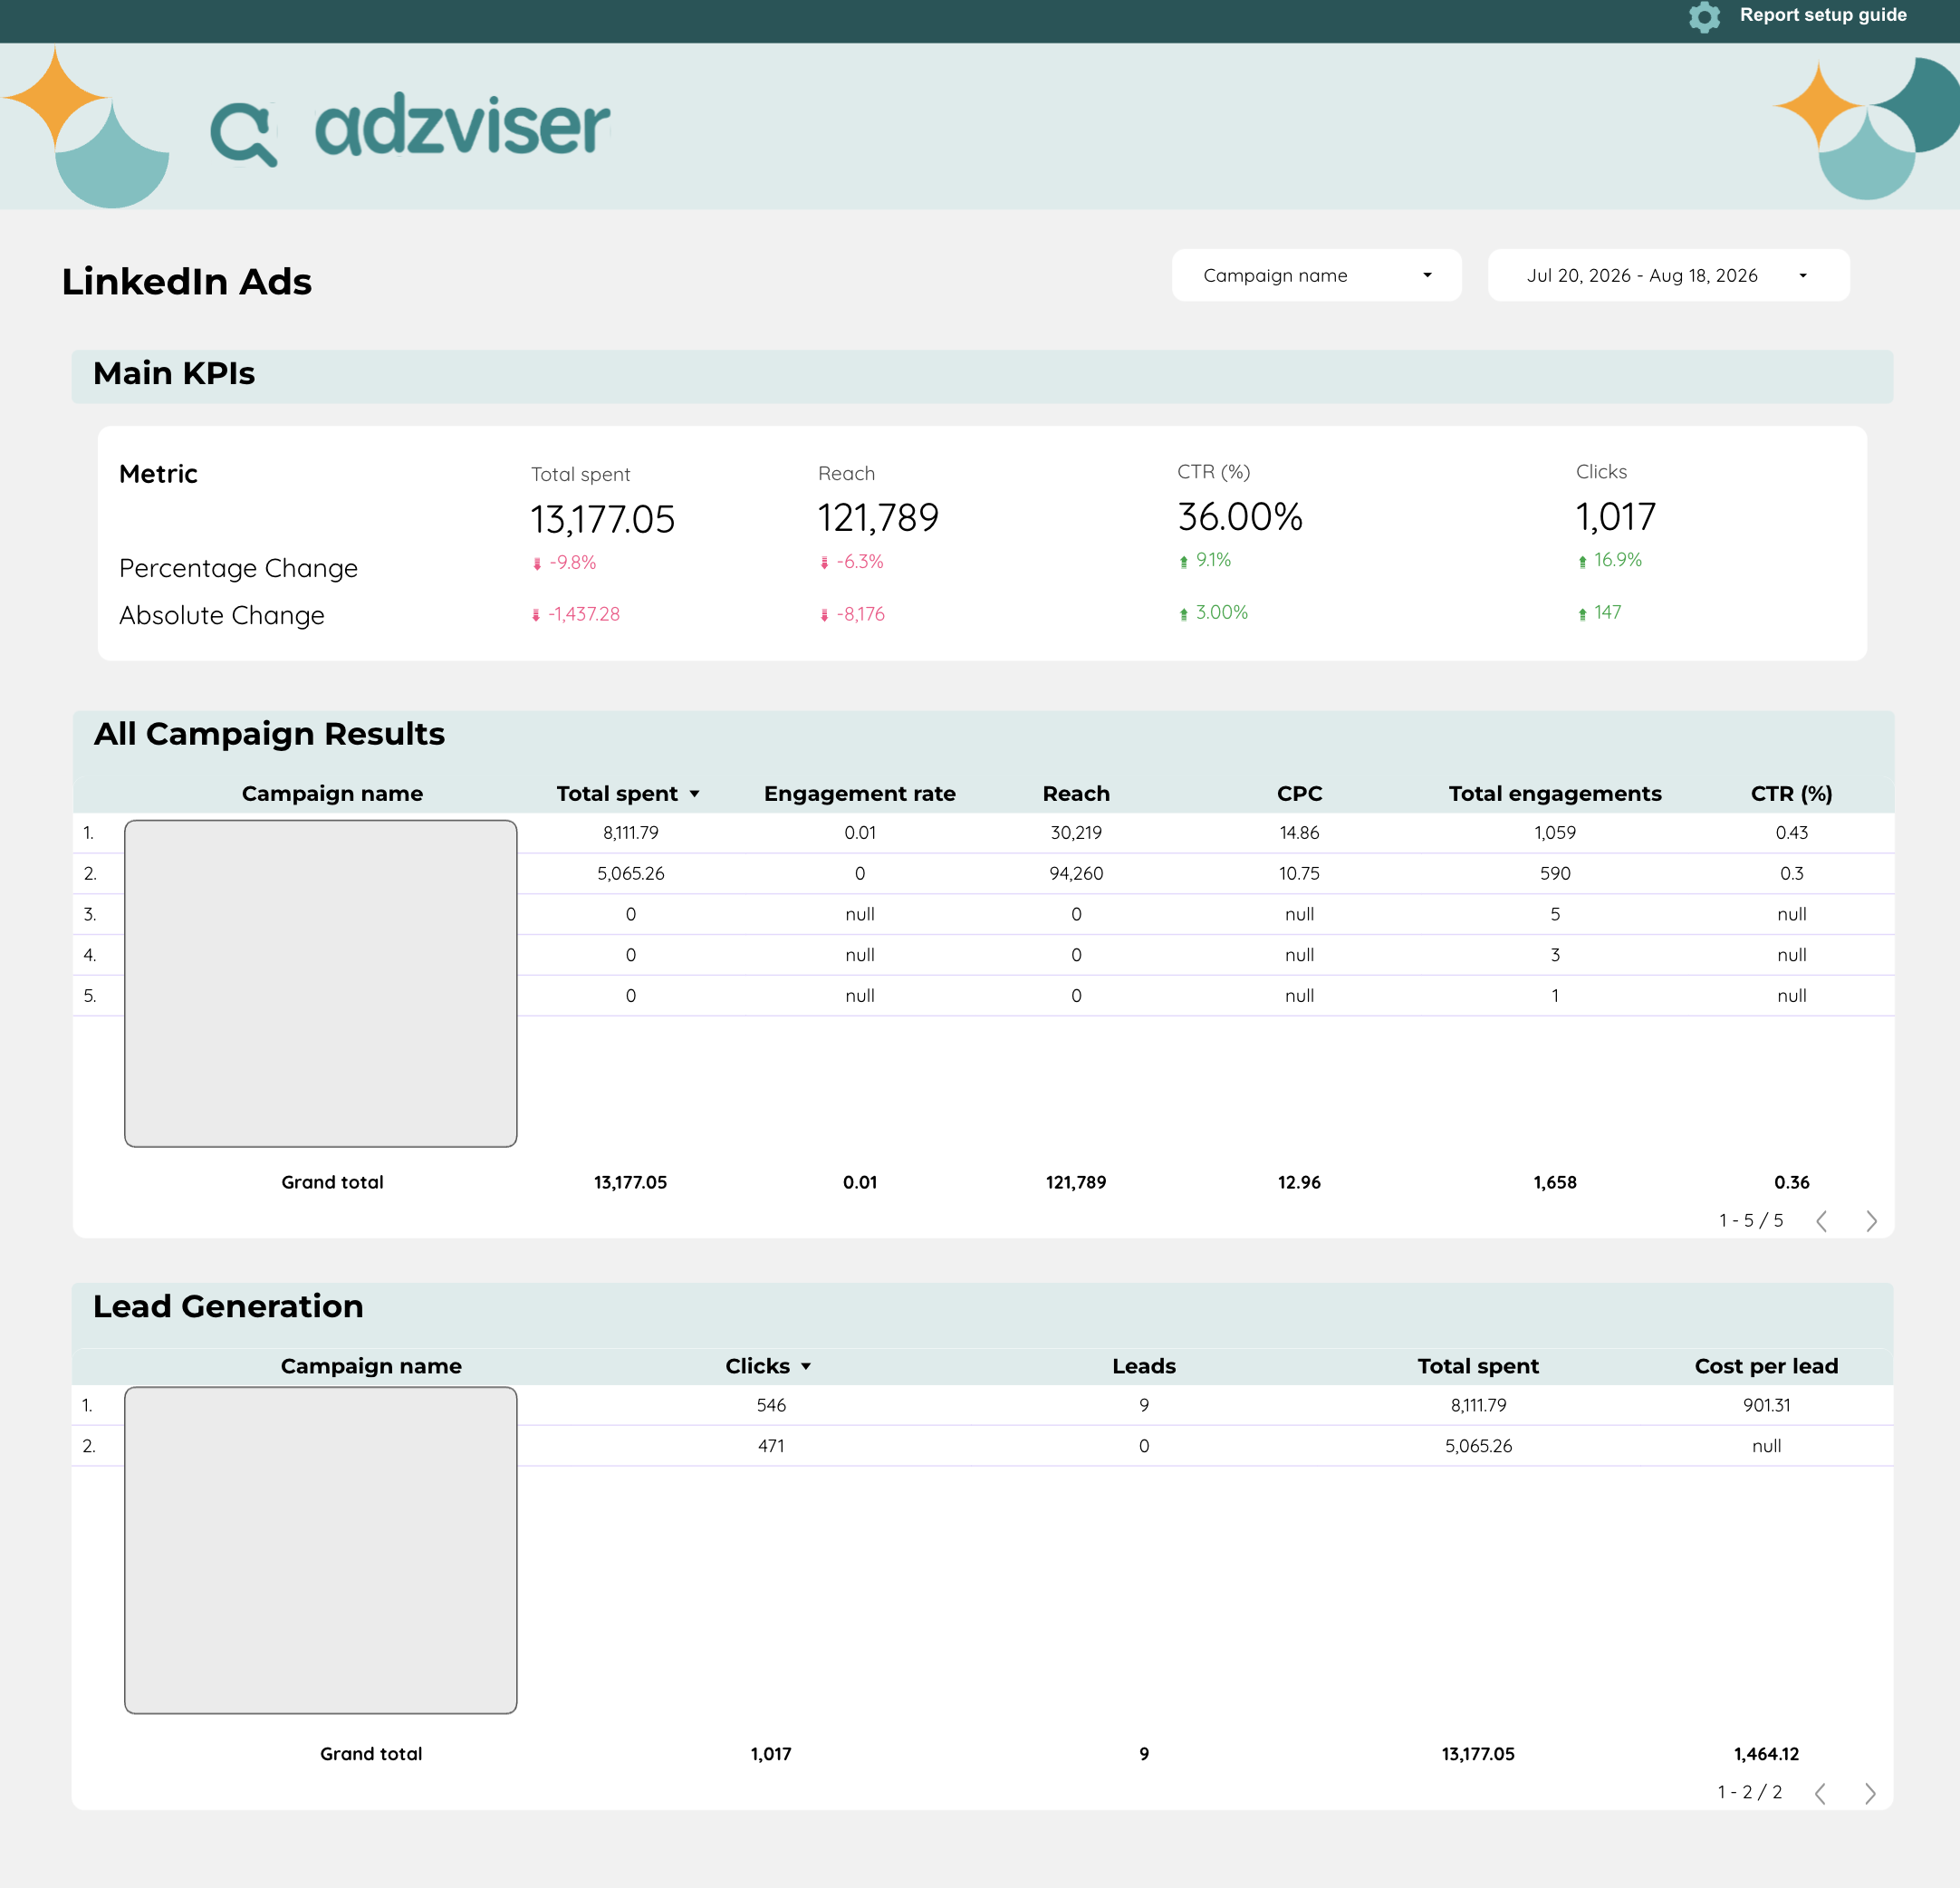
LinkedIn Ads Lead Generation
A LinkedIn Ads dashboard for Data Studio — track total spend, reach, CTR, and clicks with period-over-period comparison, an all-campaign results table, and a dedicated lead generation breakdown with cost per lead.
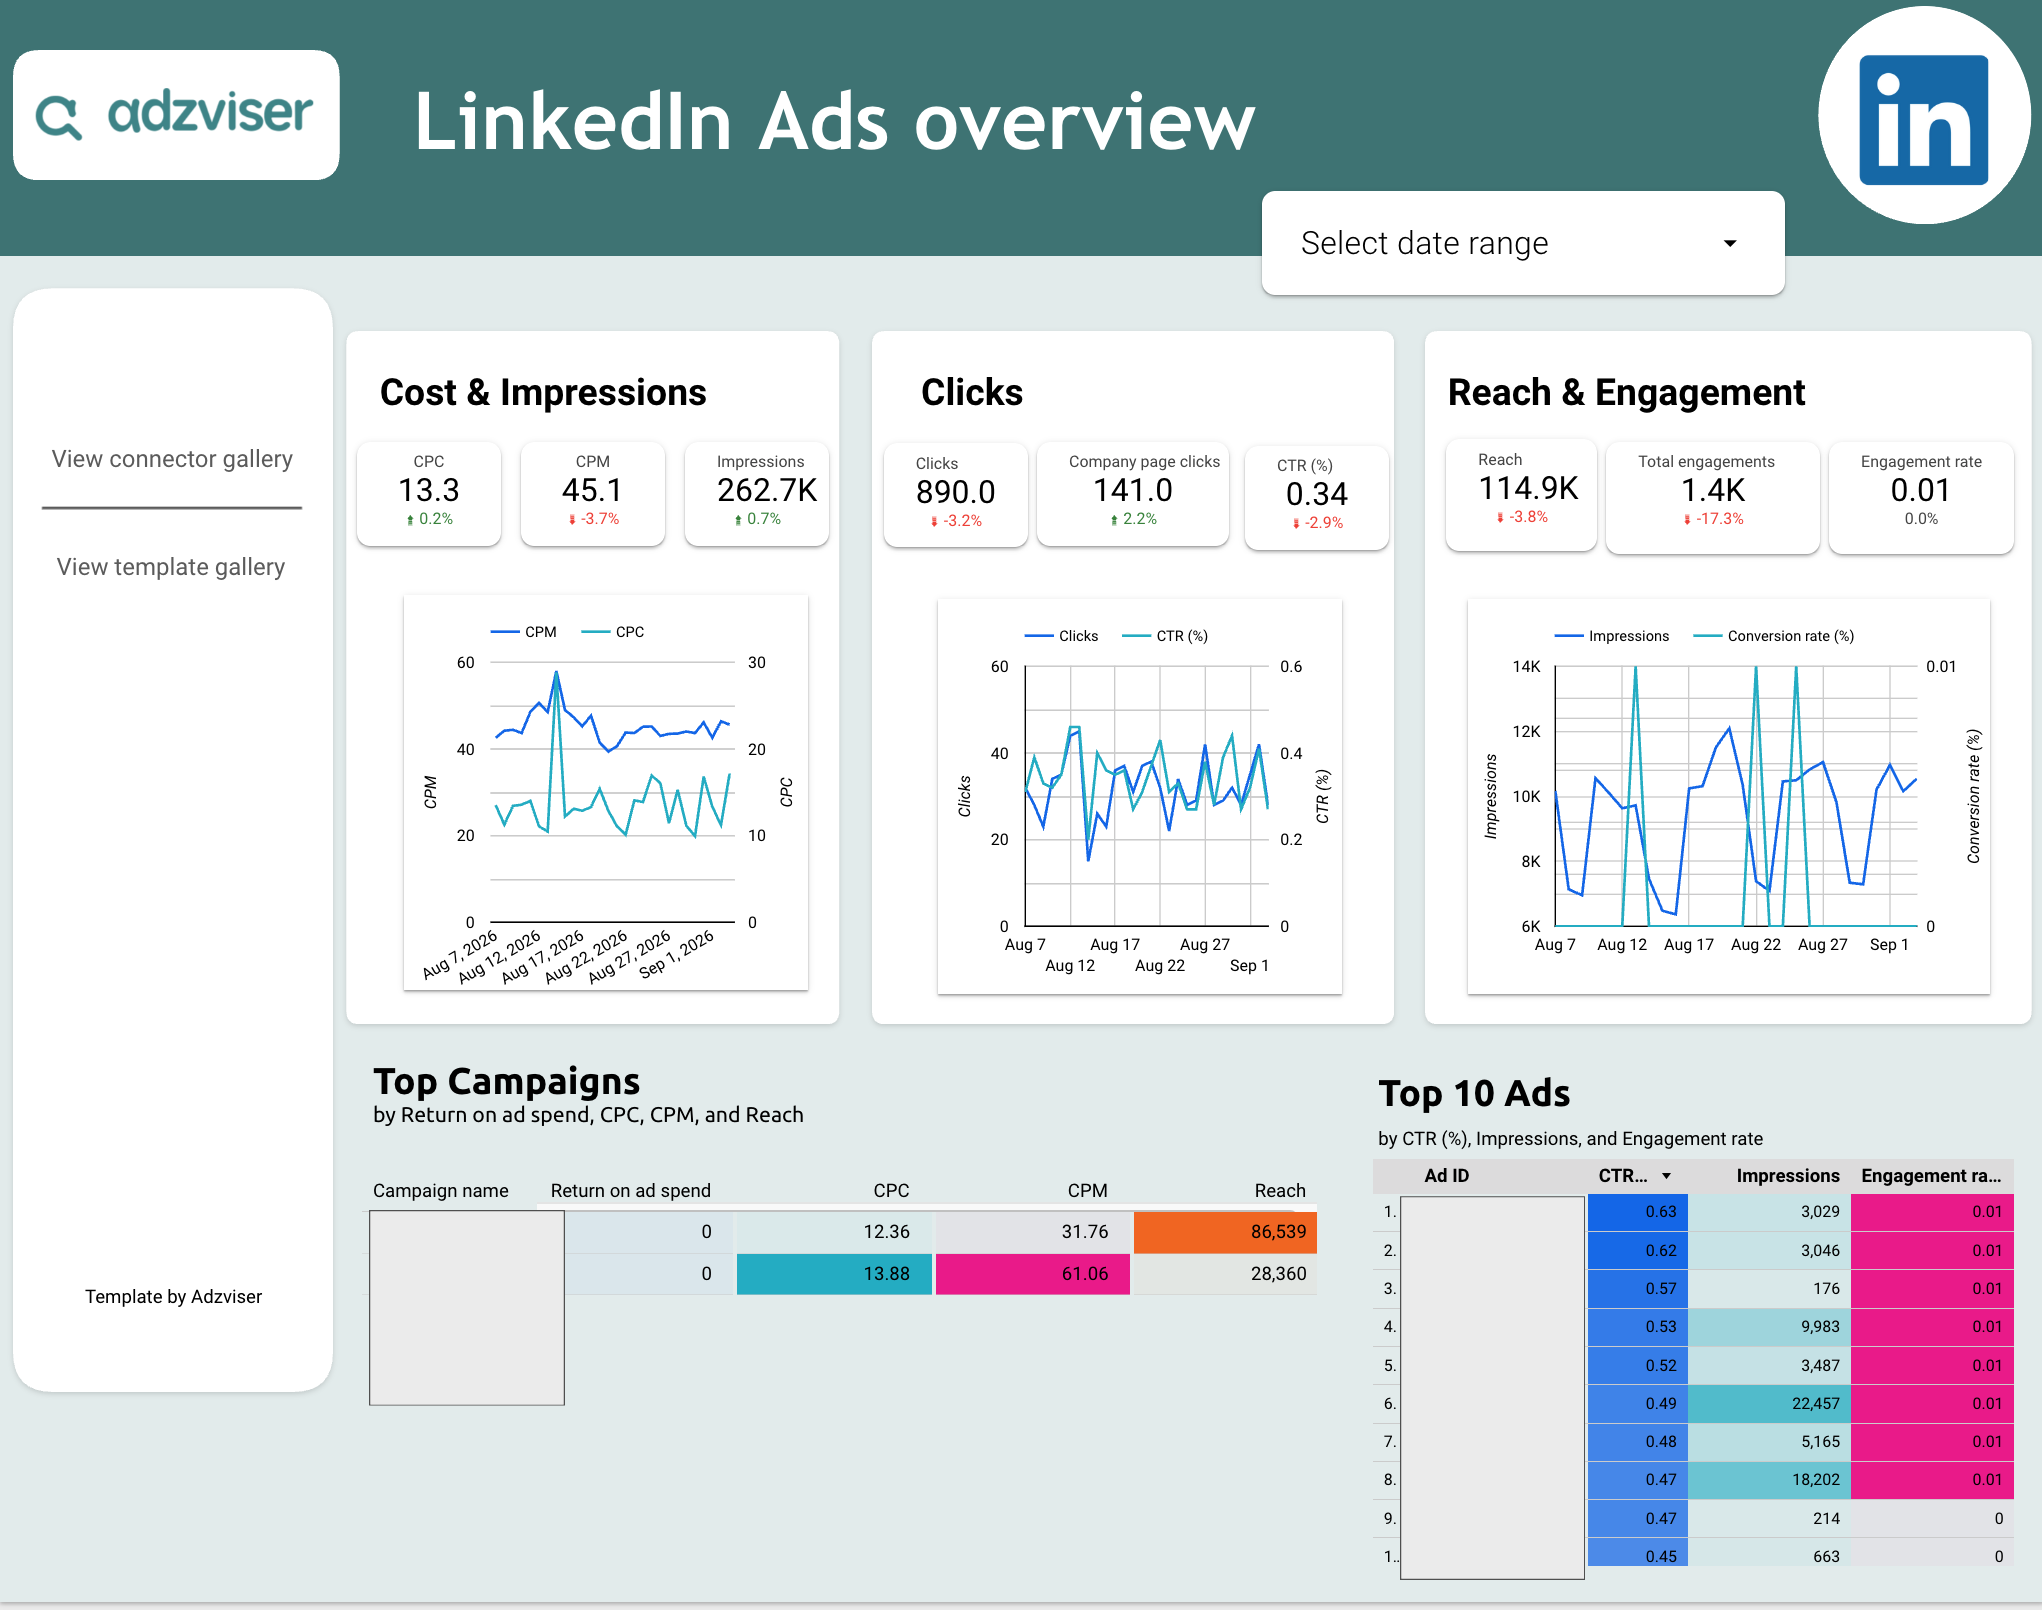
LinkedIn Ads Overview
A two-page LinkedIn Ads dashboard for Data Studio — an overview page tracking CPC, CPM, impressions, clicks, reach, and engagement with top-campaigns and top-creatives tables, plus a breakdown page by device, country, and campaign objective.
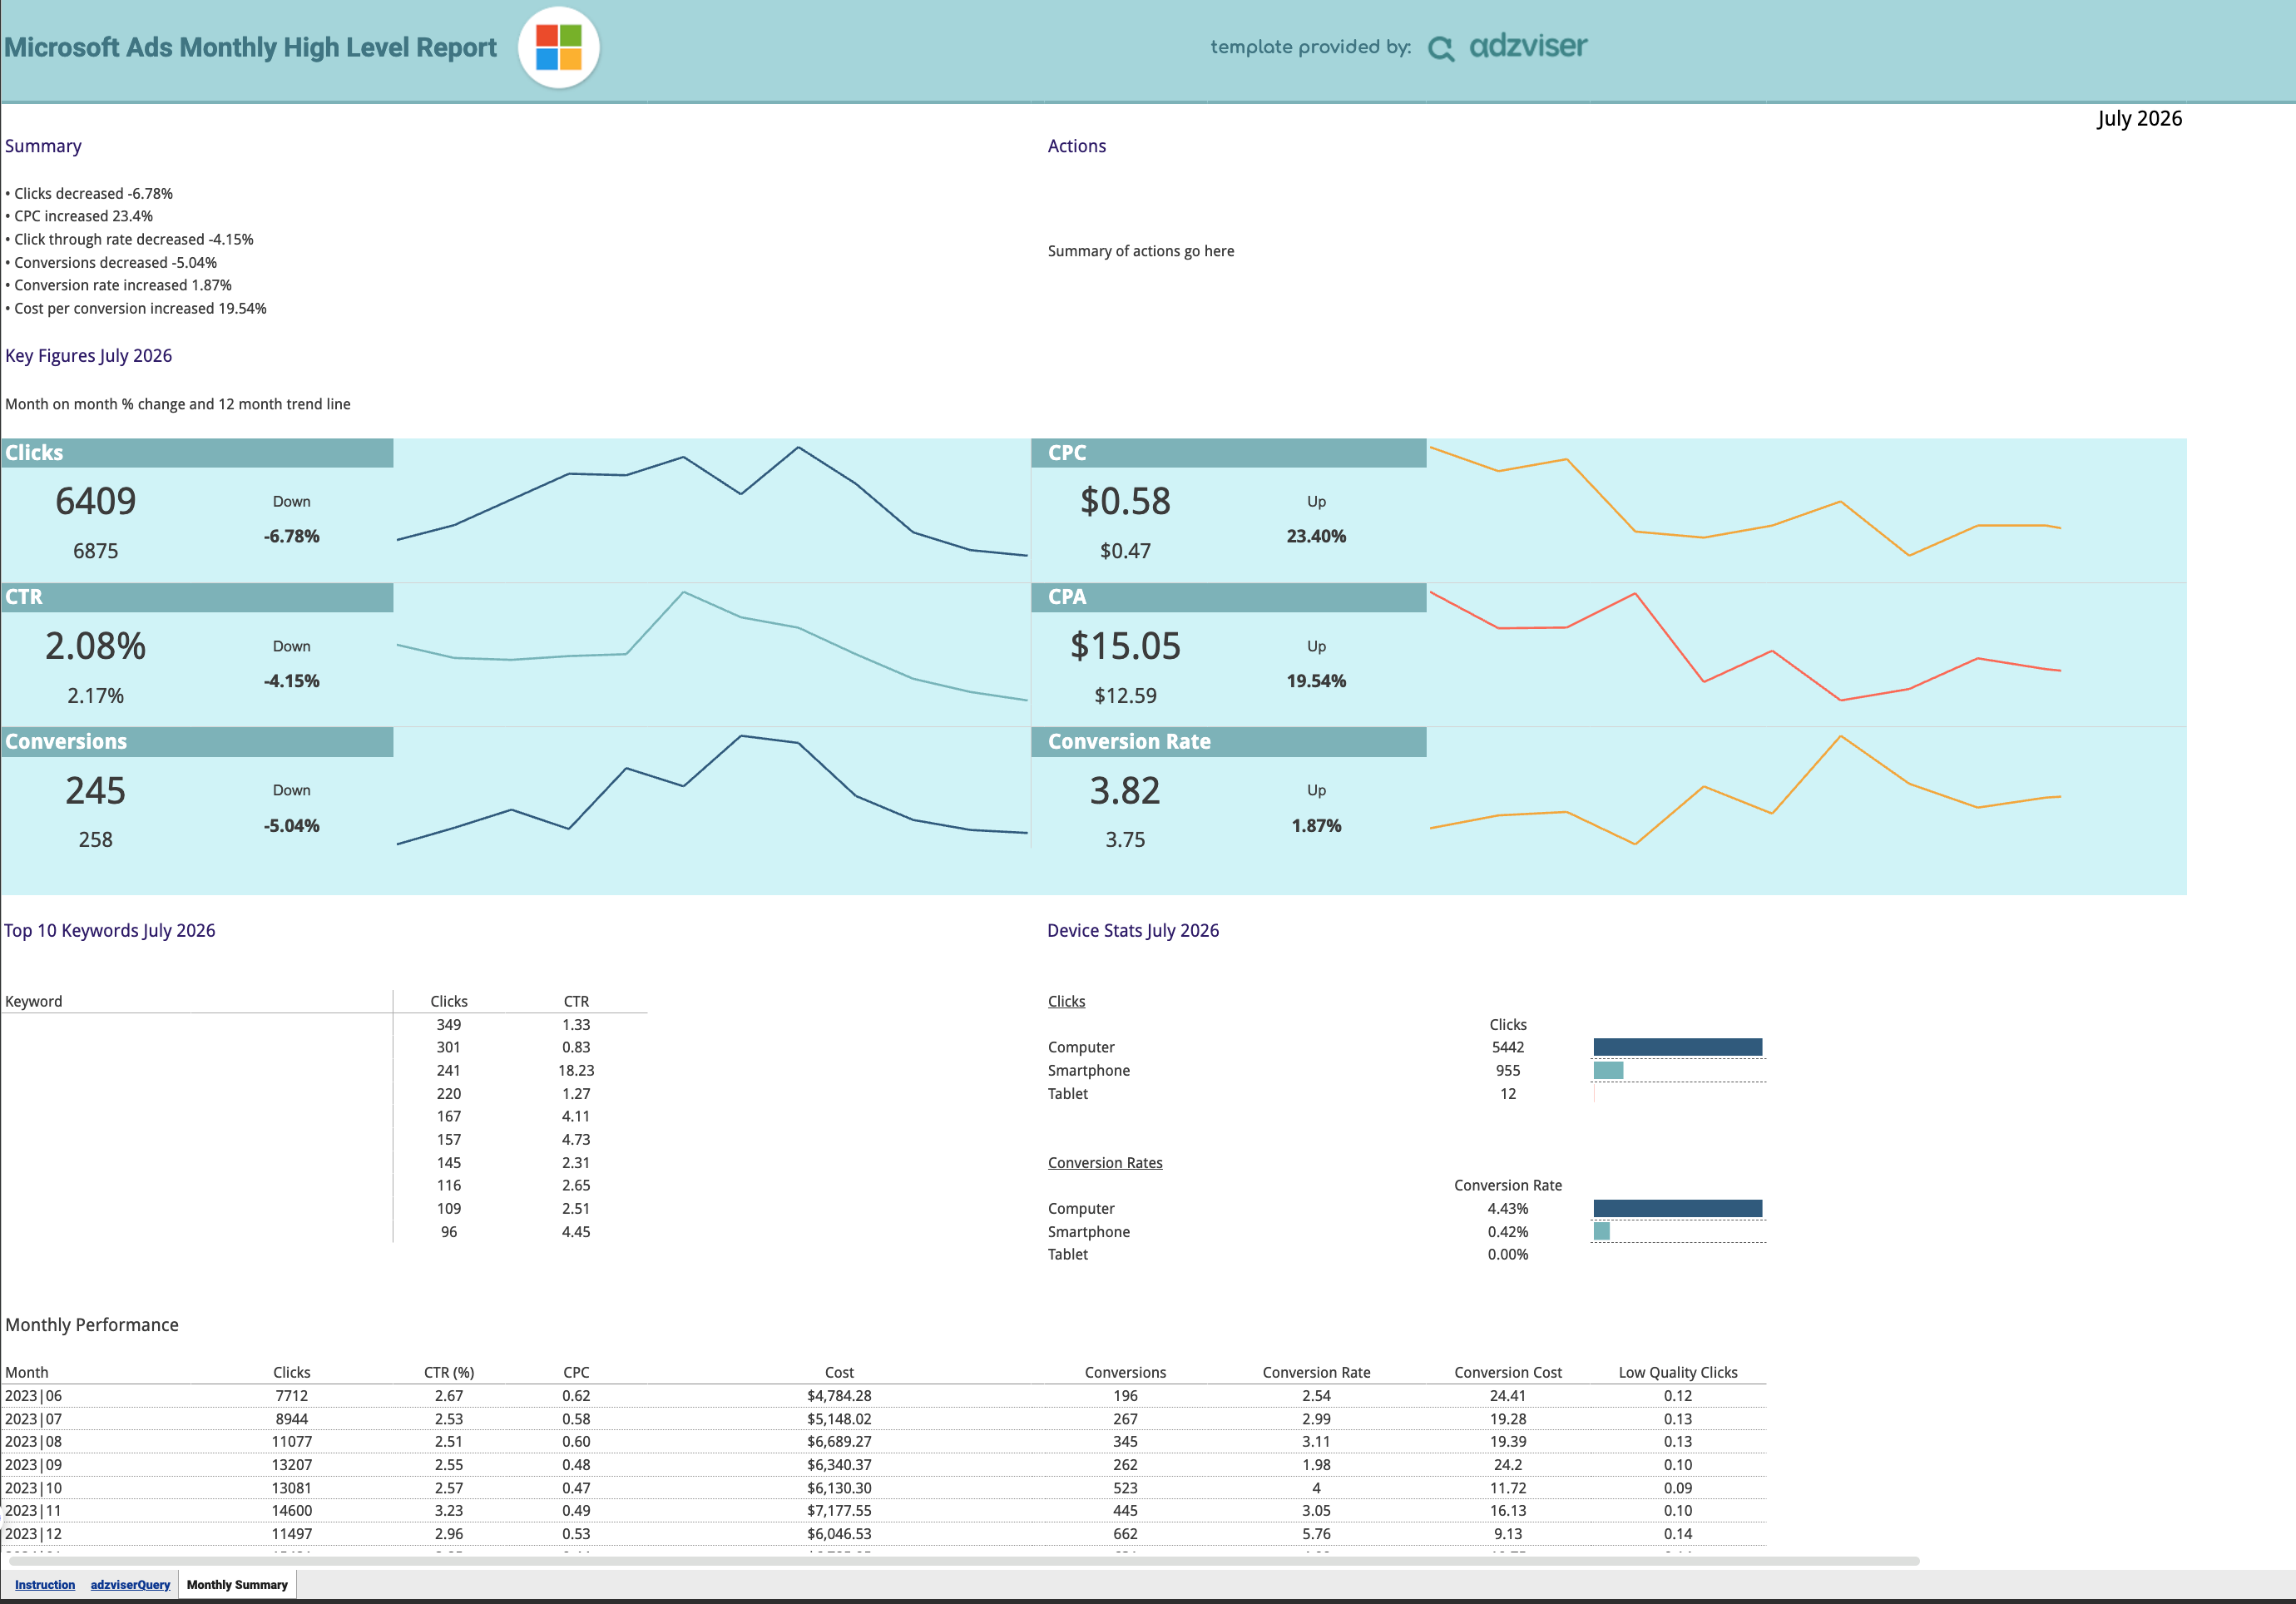

Microsoft Ads Monthly High Level Report
A Microsoft Ads monthly high-level report for Google Sheets — track clicks, CPC, CTR, conversions, conversion rate, and CPA with a 12-month trend line, plus top-10 keywords, device stats, and a monthly performance table.
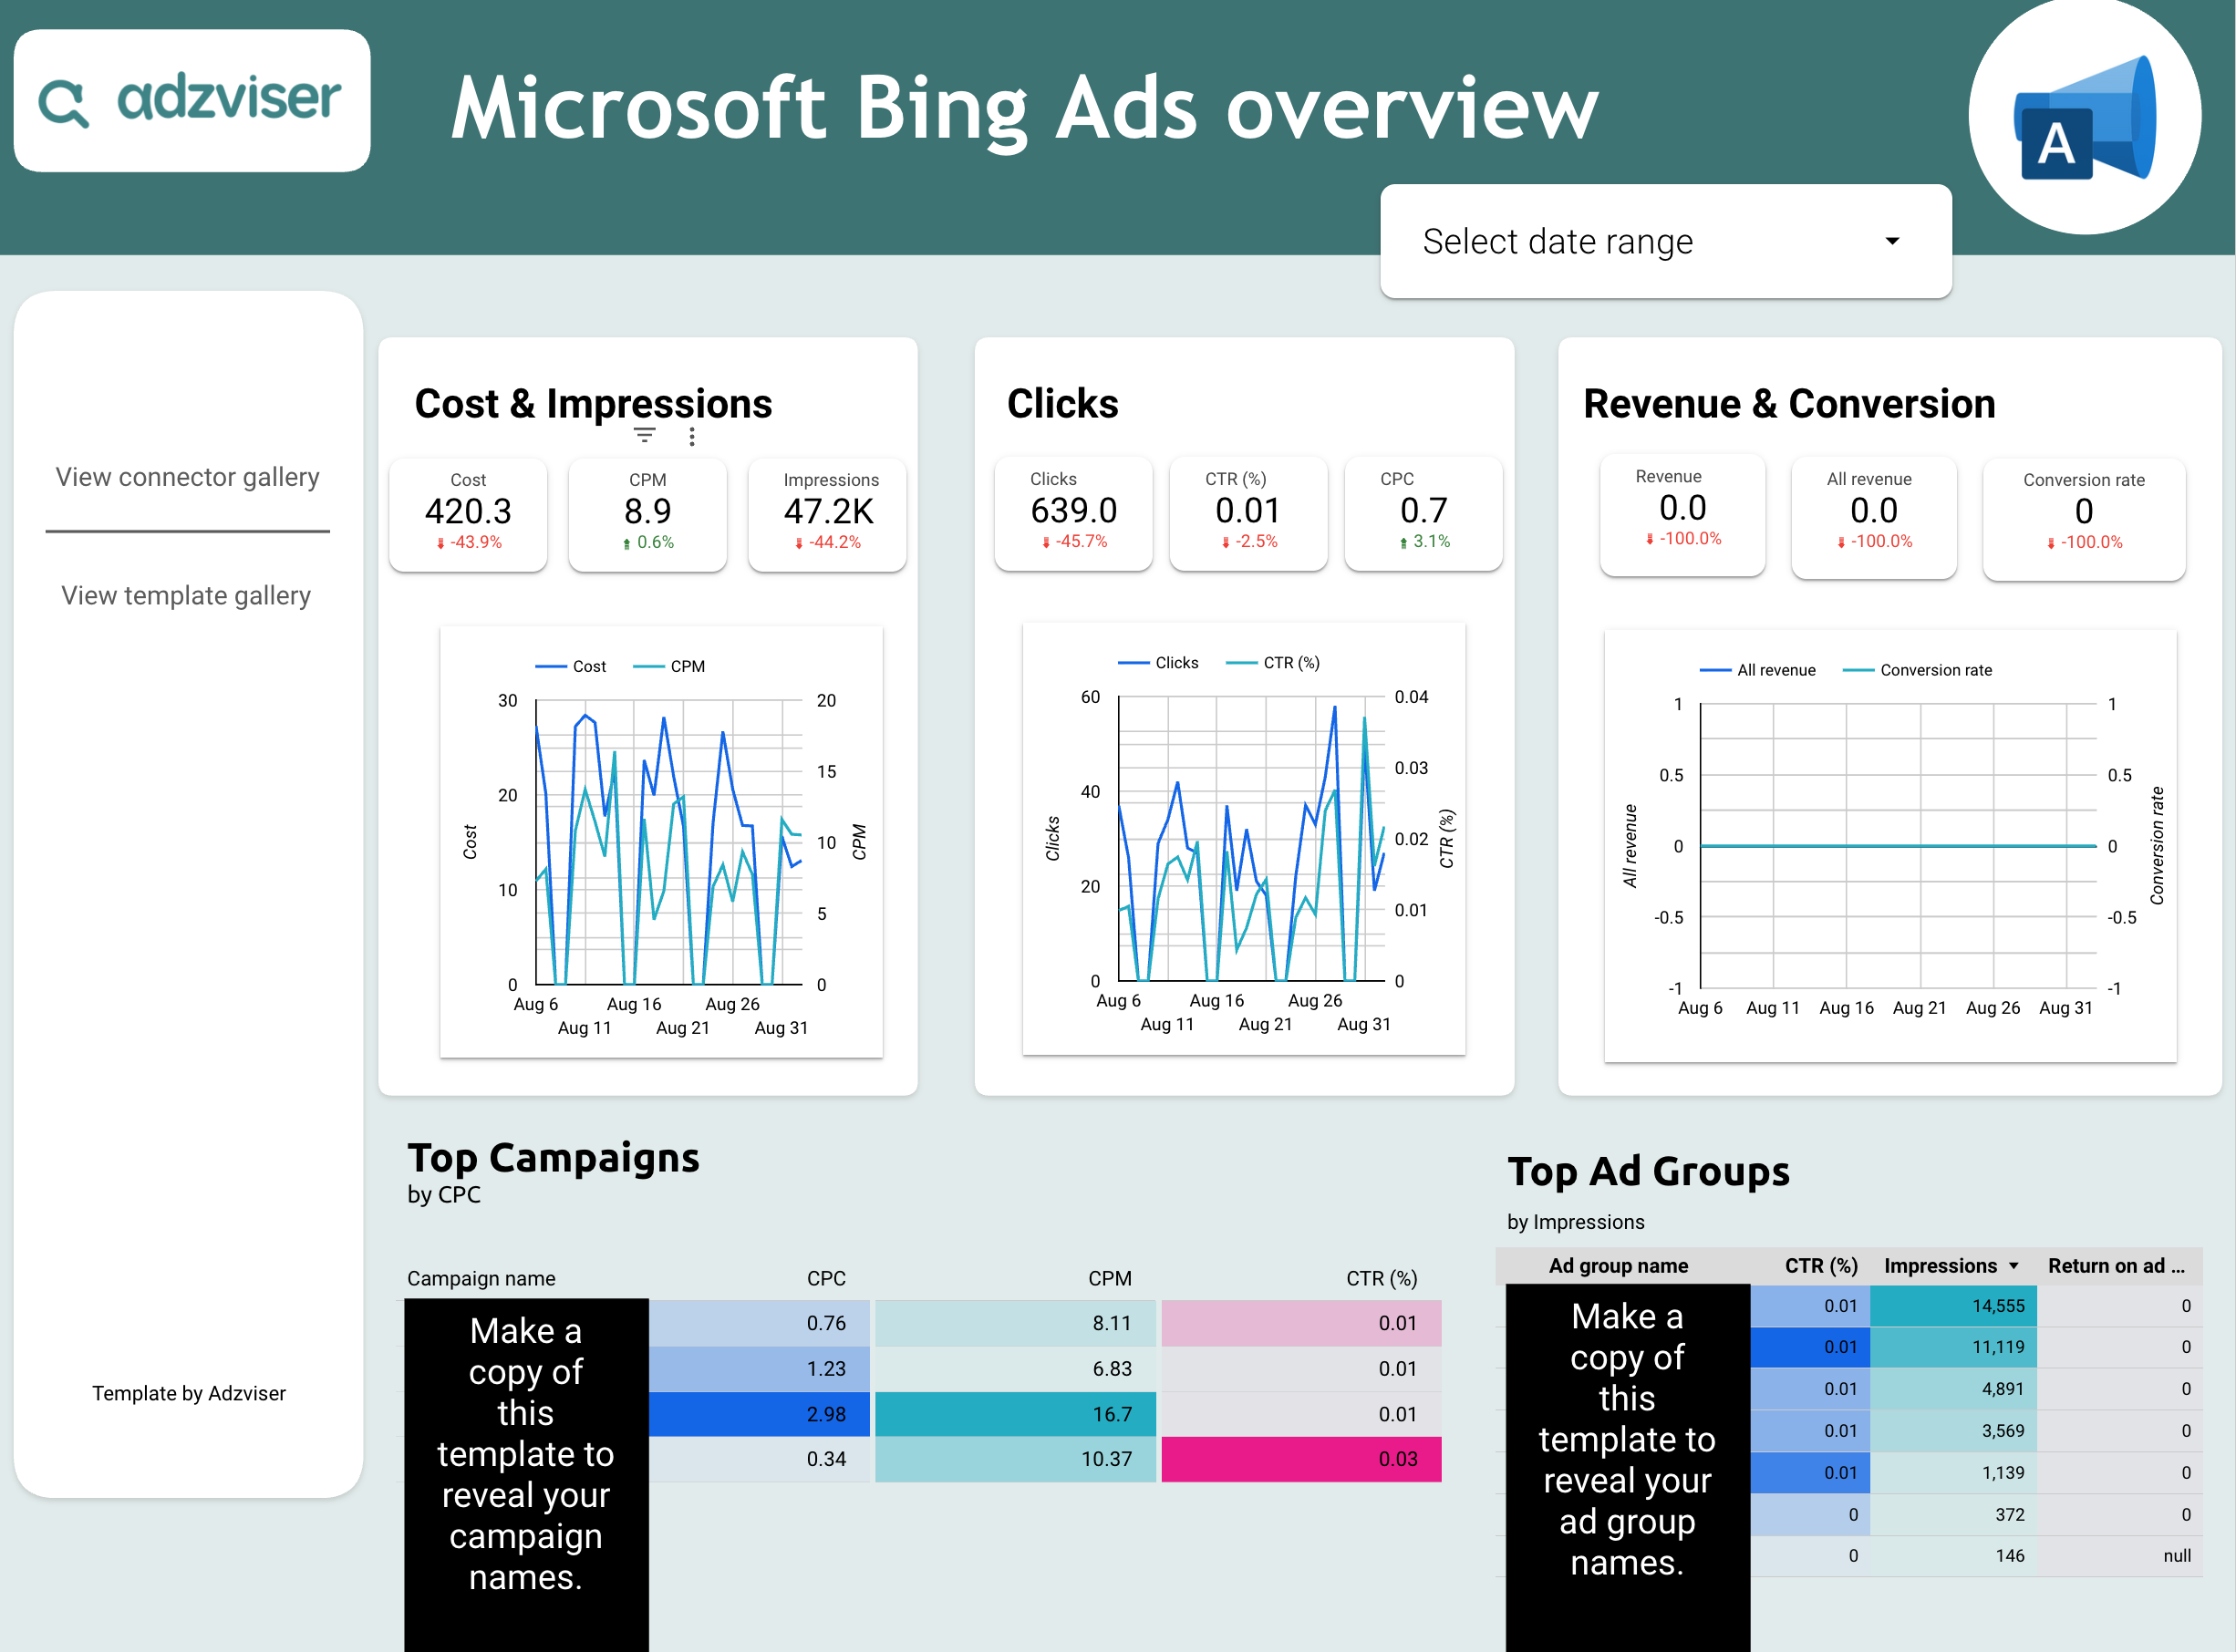
Microsoft Ads Overview
A two-page Microsoft (Bing) Ads dashboard for Data Studio — an overview page tracking cost, CPM, impressions, clicks, CTR, CPC, revenue, and conversion rate with trend charts and top-campaign/ad-group tables, plus a breakdown page by age, gender, visitor country, and device type.
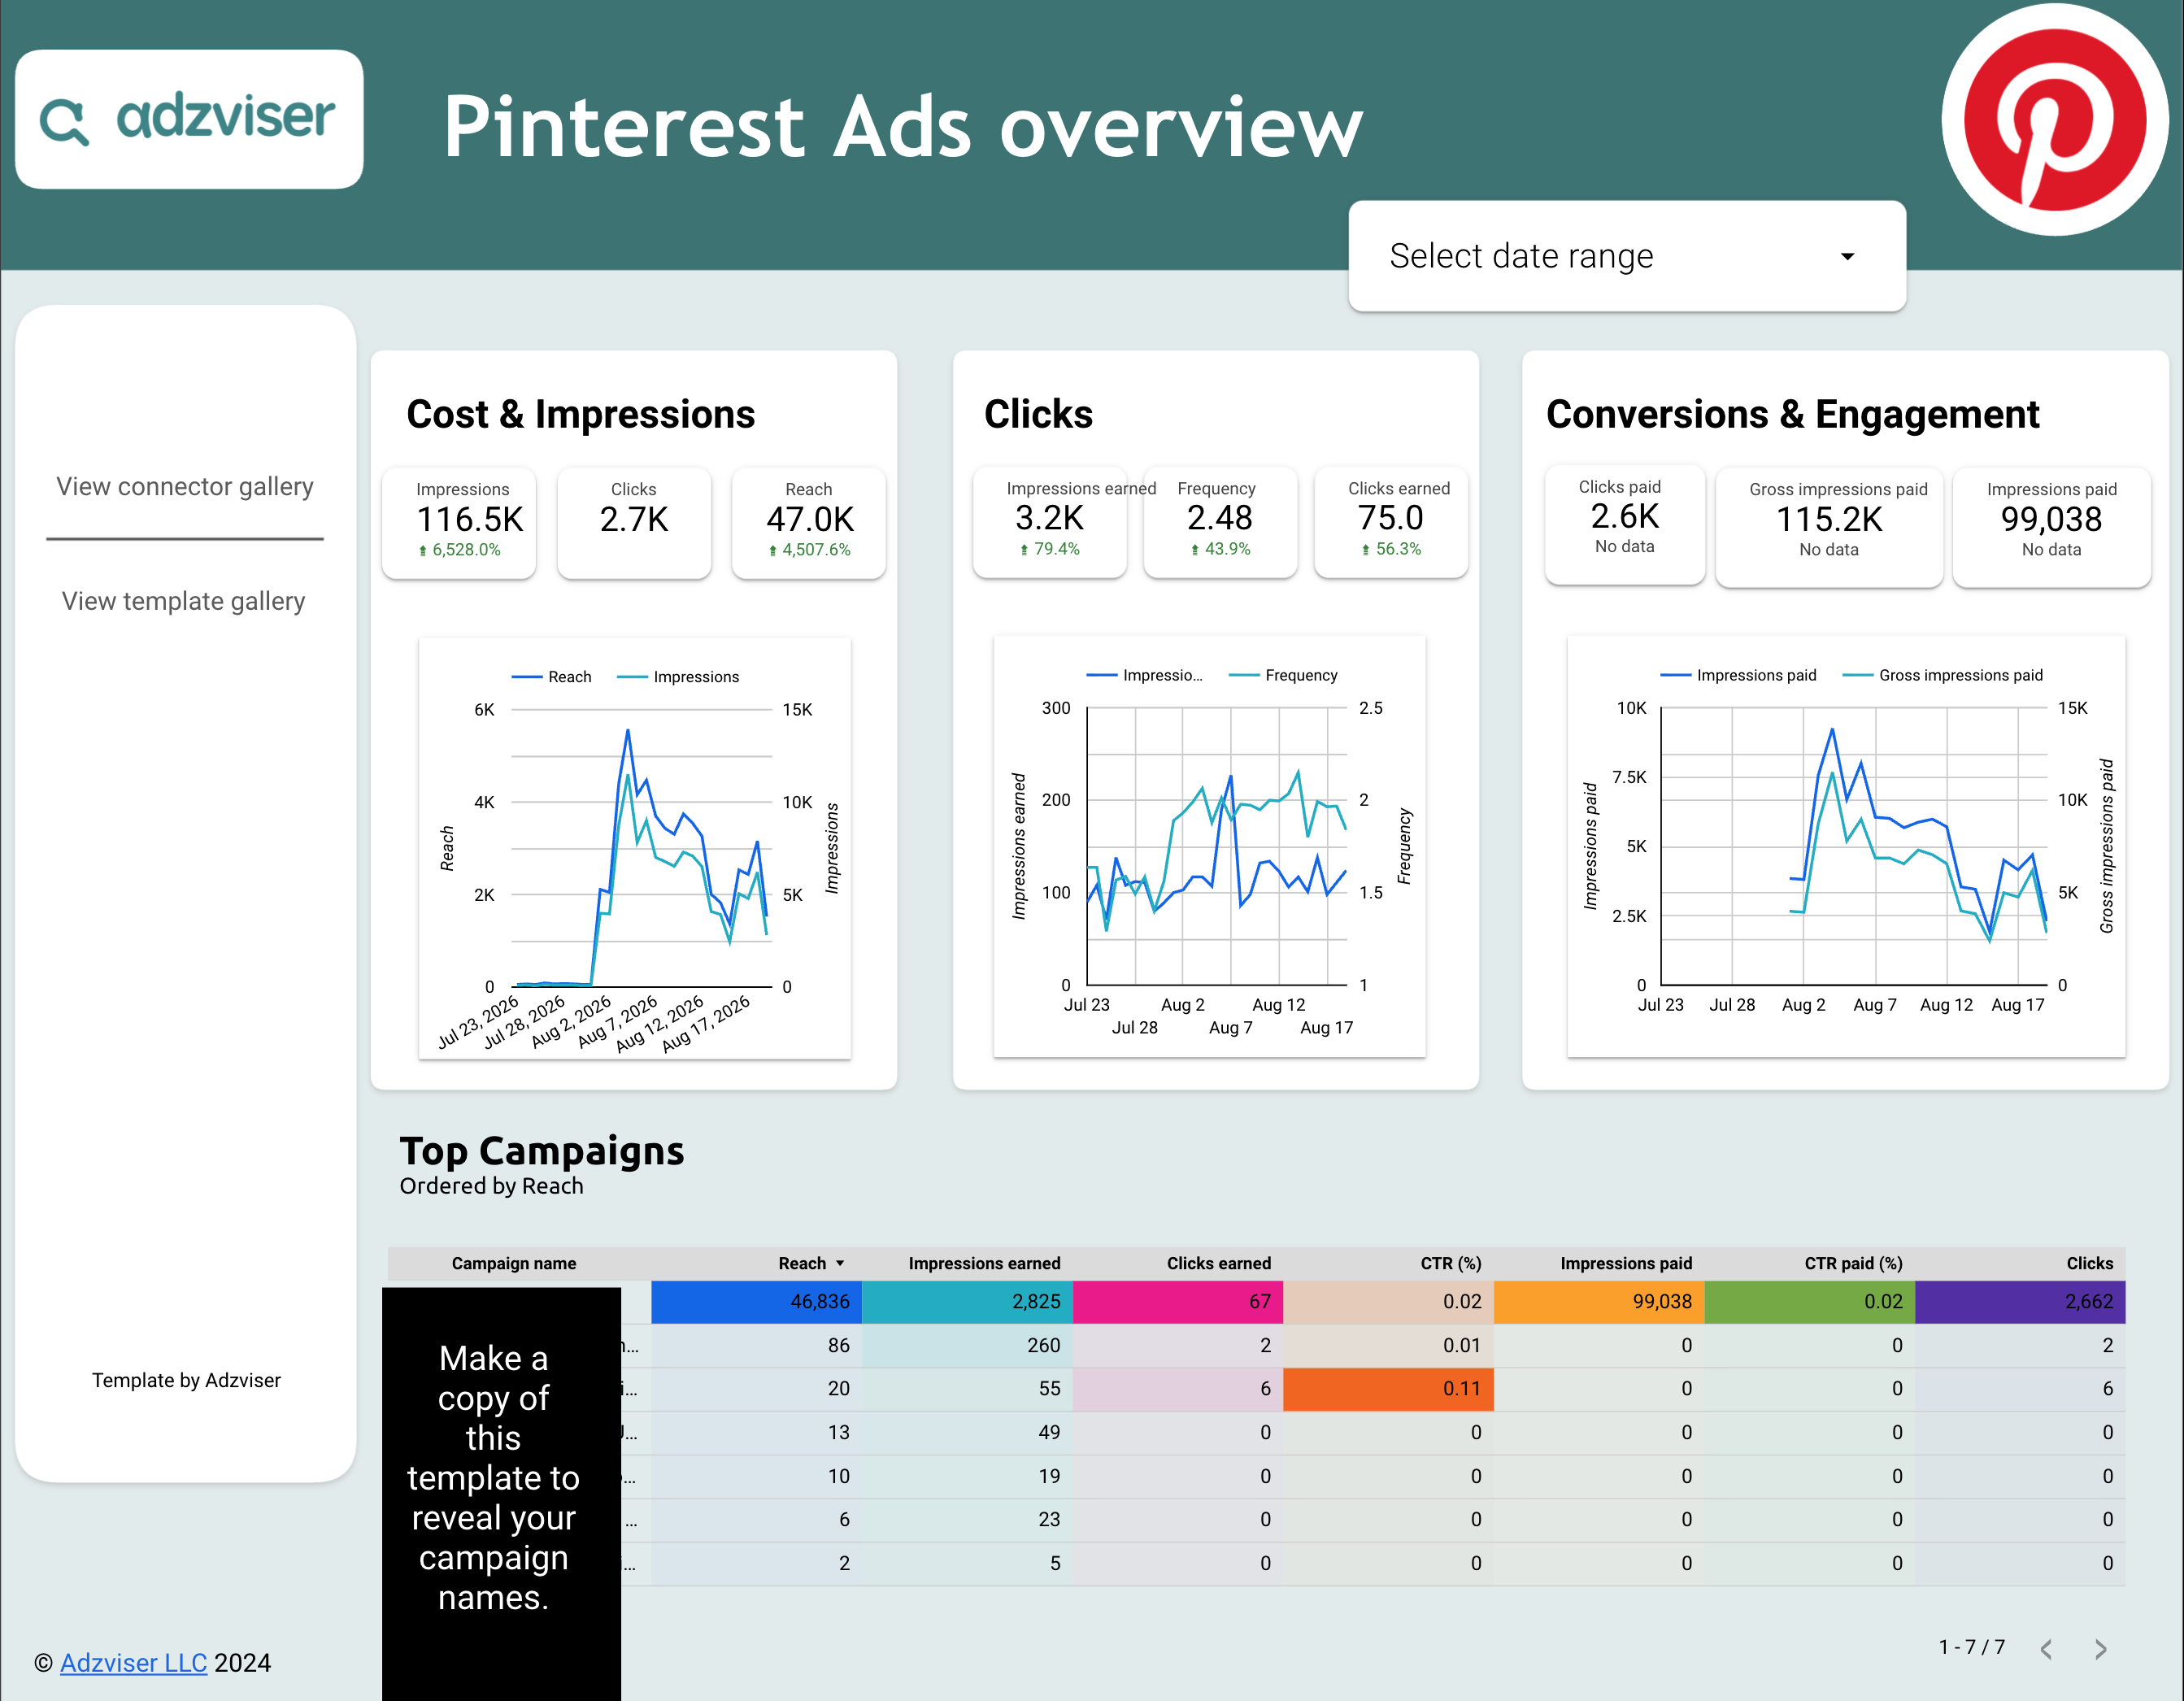

Pinterest Ads Overview
A Pinterest Ads dashboard for Data Studio — track cost, impressions, clicks, CTR, CPC, conversions, and engagements at a glance, with cost, click, and conversion trend charts and a top-campaigns table.
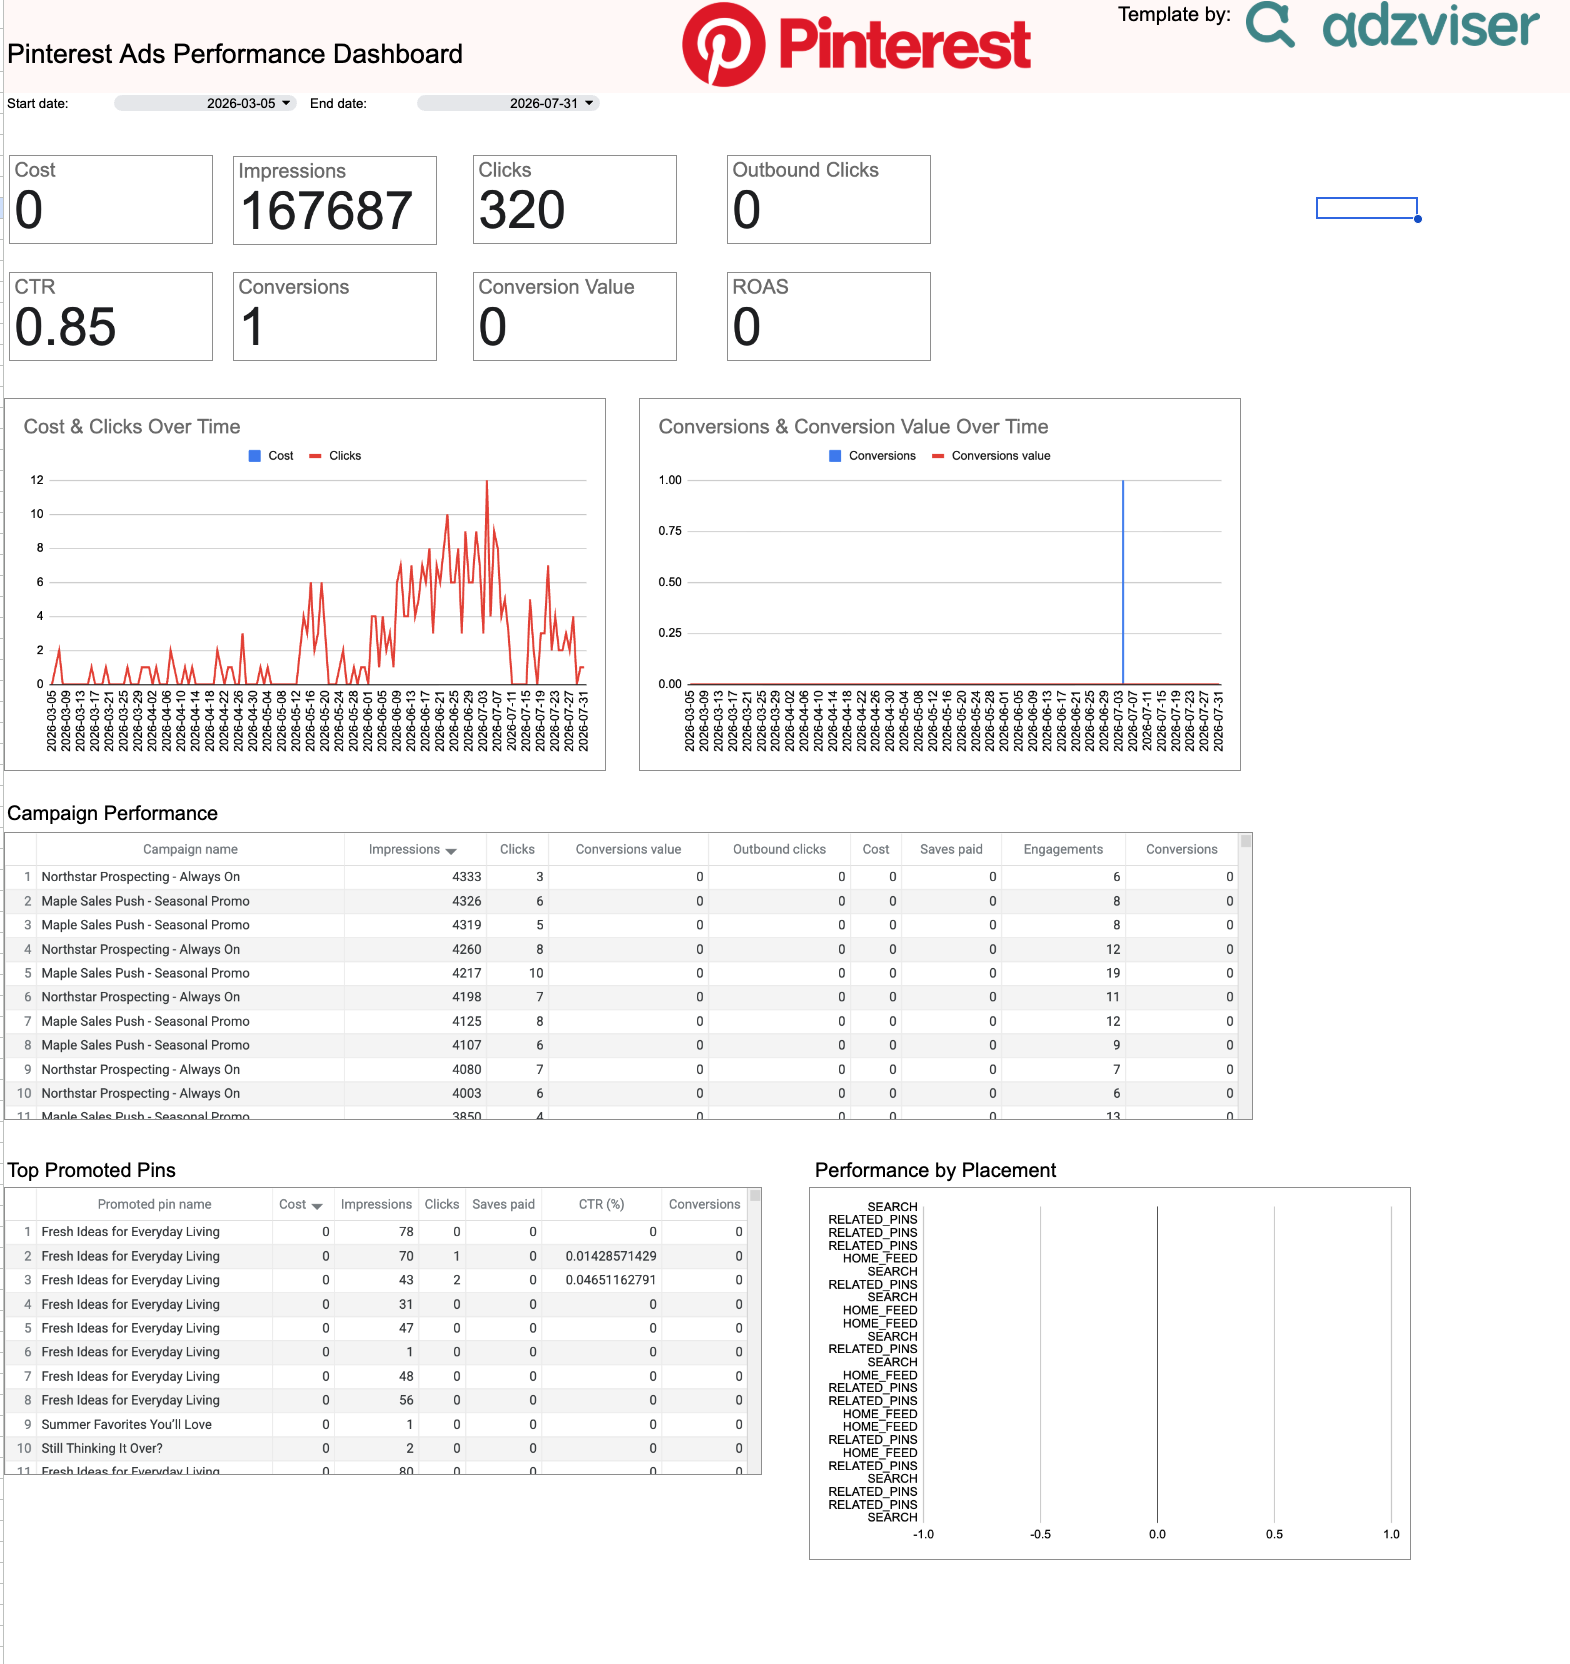
Pinterest Ads Performance Dashboard
A Pinterest Ads performance dashboard for Google Sheets — track cost, impressions, clicks, outbound clicks, CTR, conversions, conversion value, and ROAS at a glance, with cost/clicks and conversions trend charts, a campaign performance table, top promoted pins, and performance by placement.
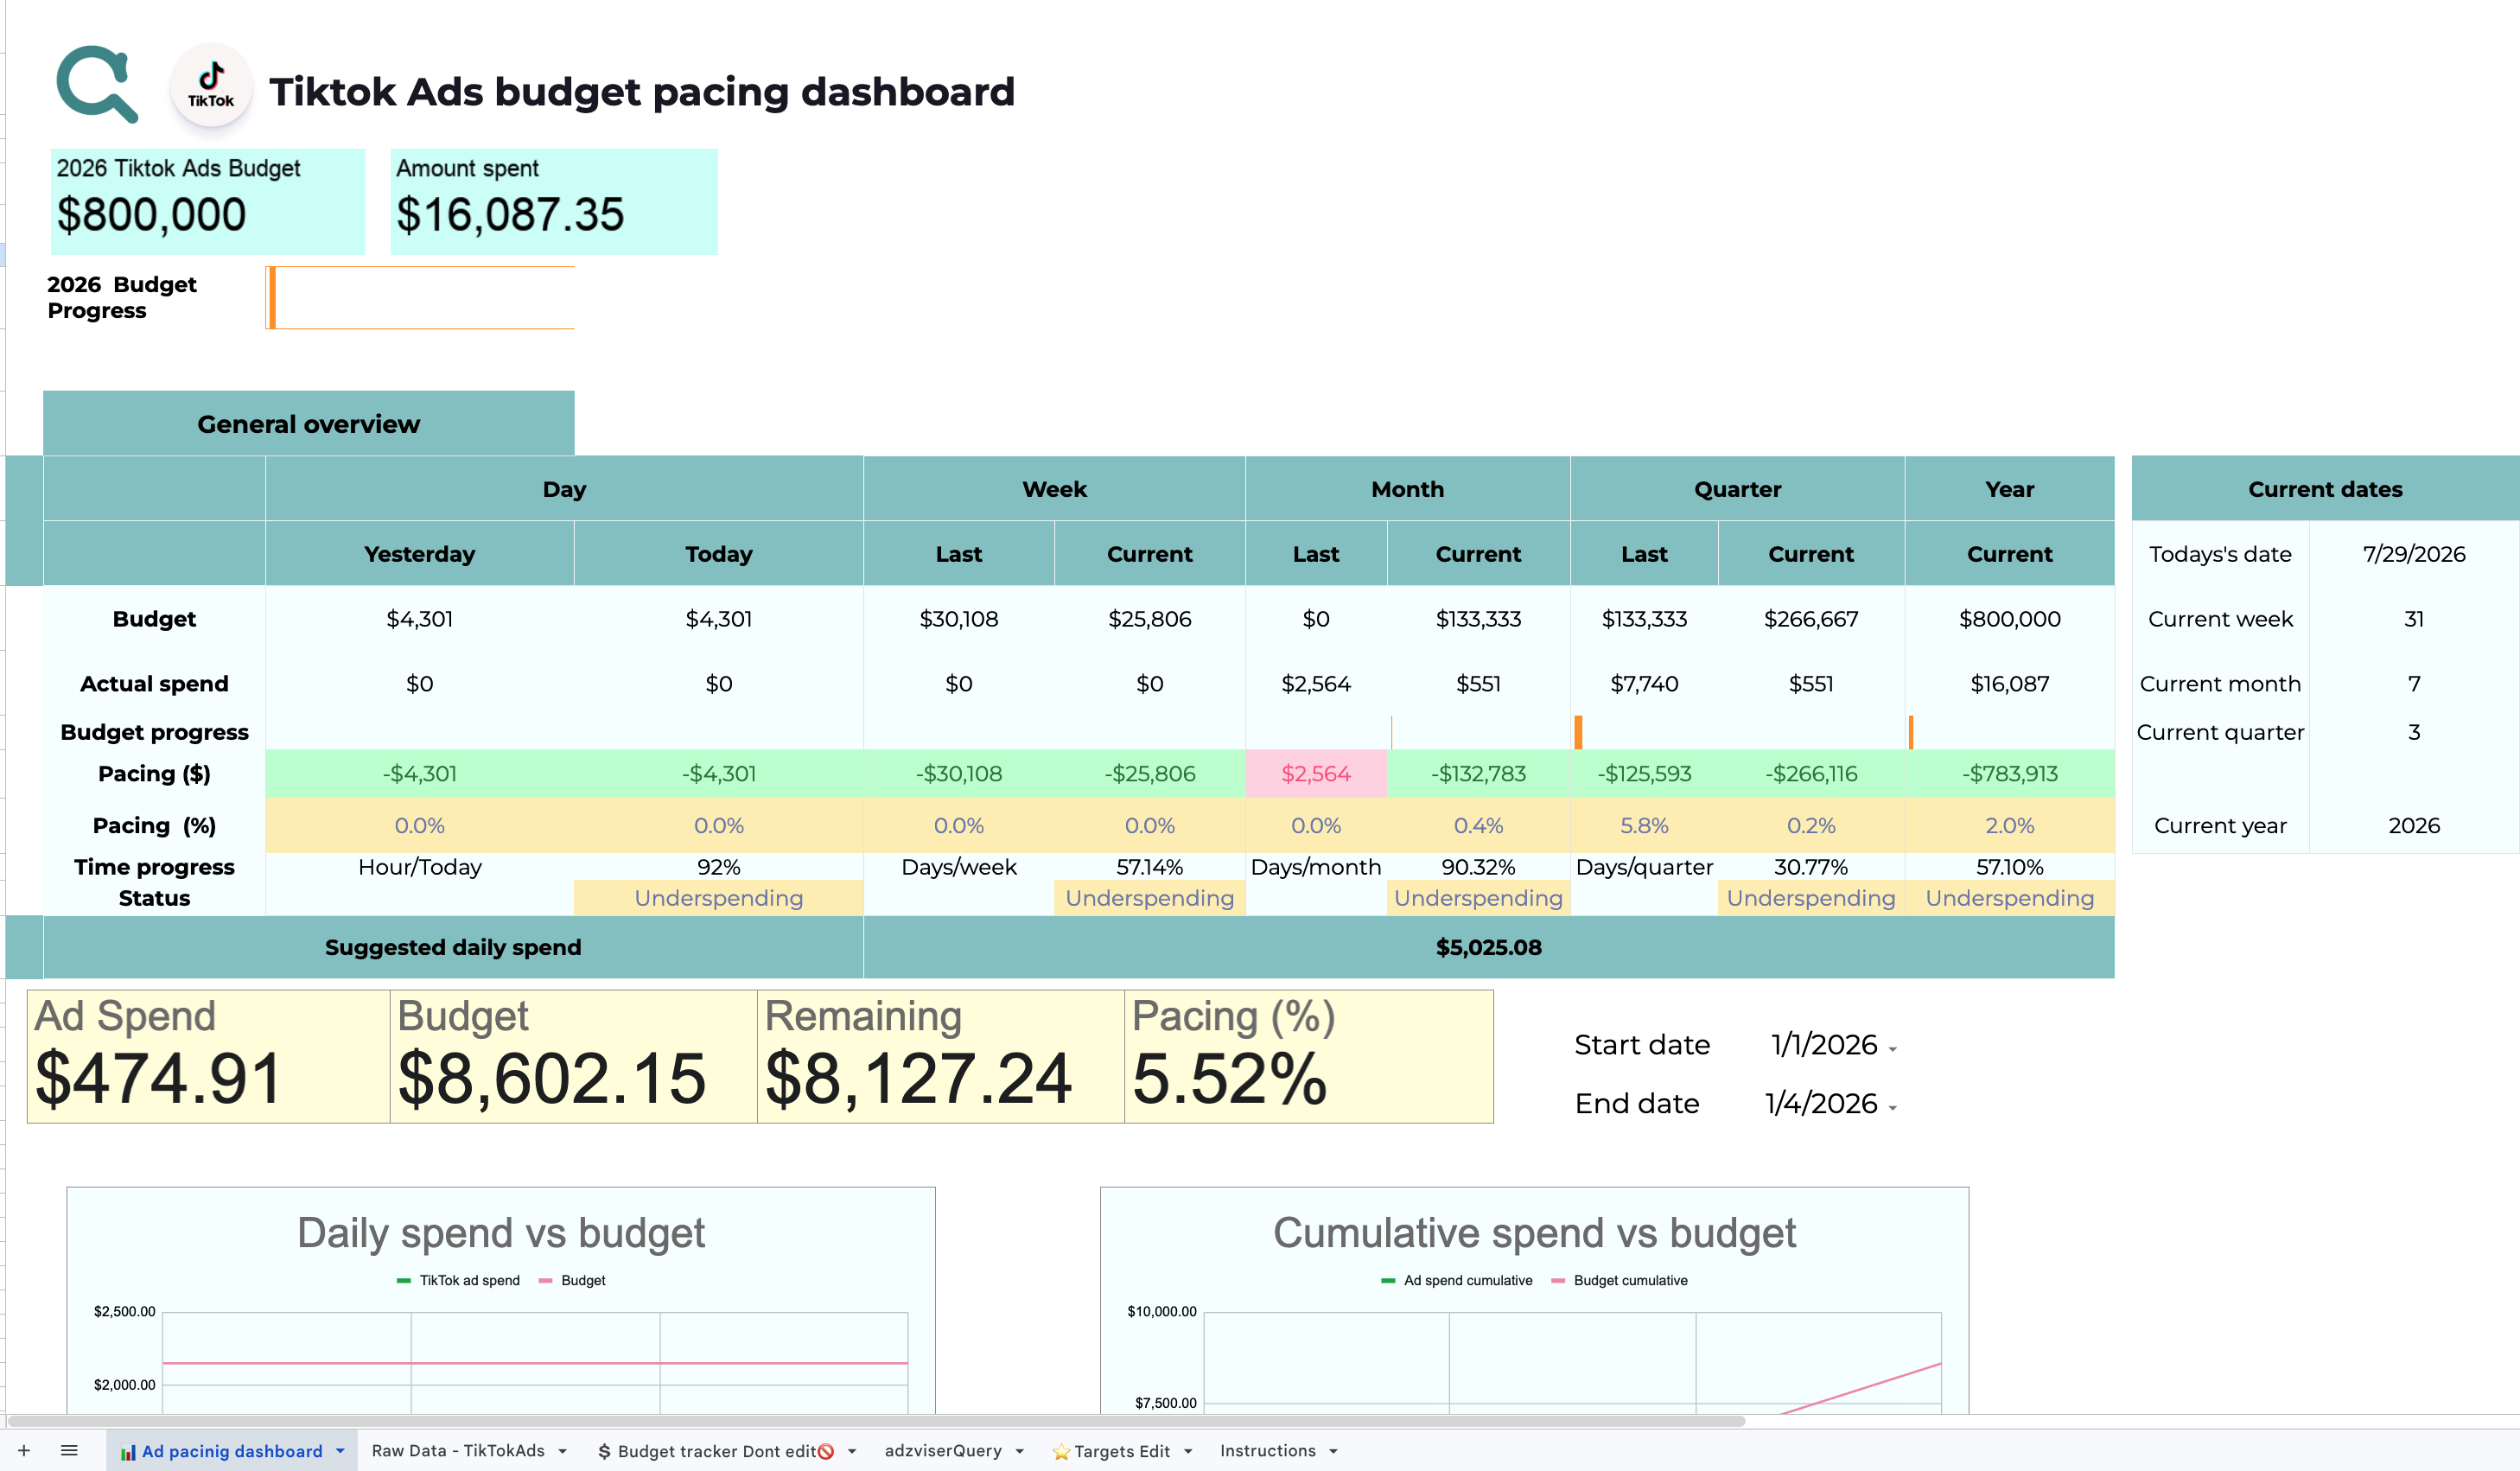

TikTok Ads Budget Pacing Dashboard
Monitor budget pacing across your TikTok Ads campaigns — track spend to date against target budget so you never over- or under-spend.
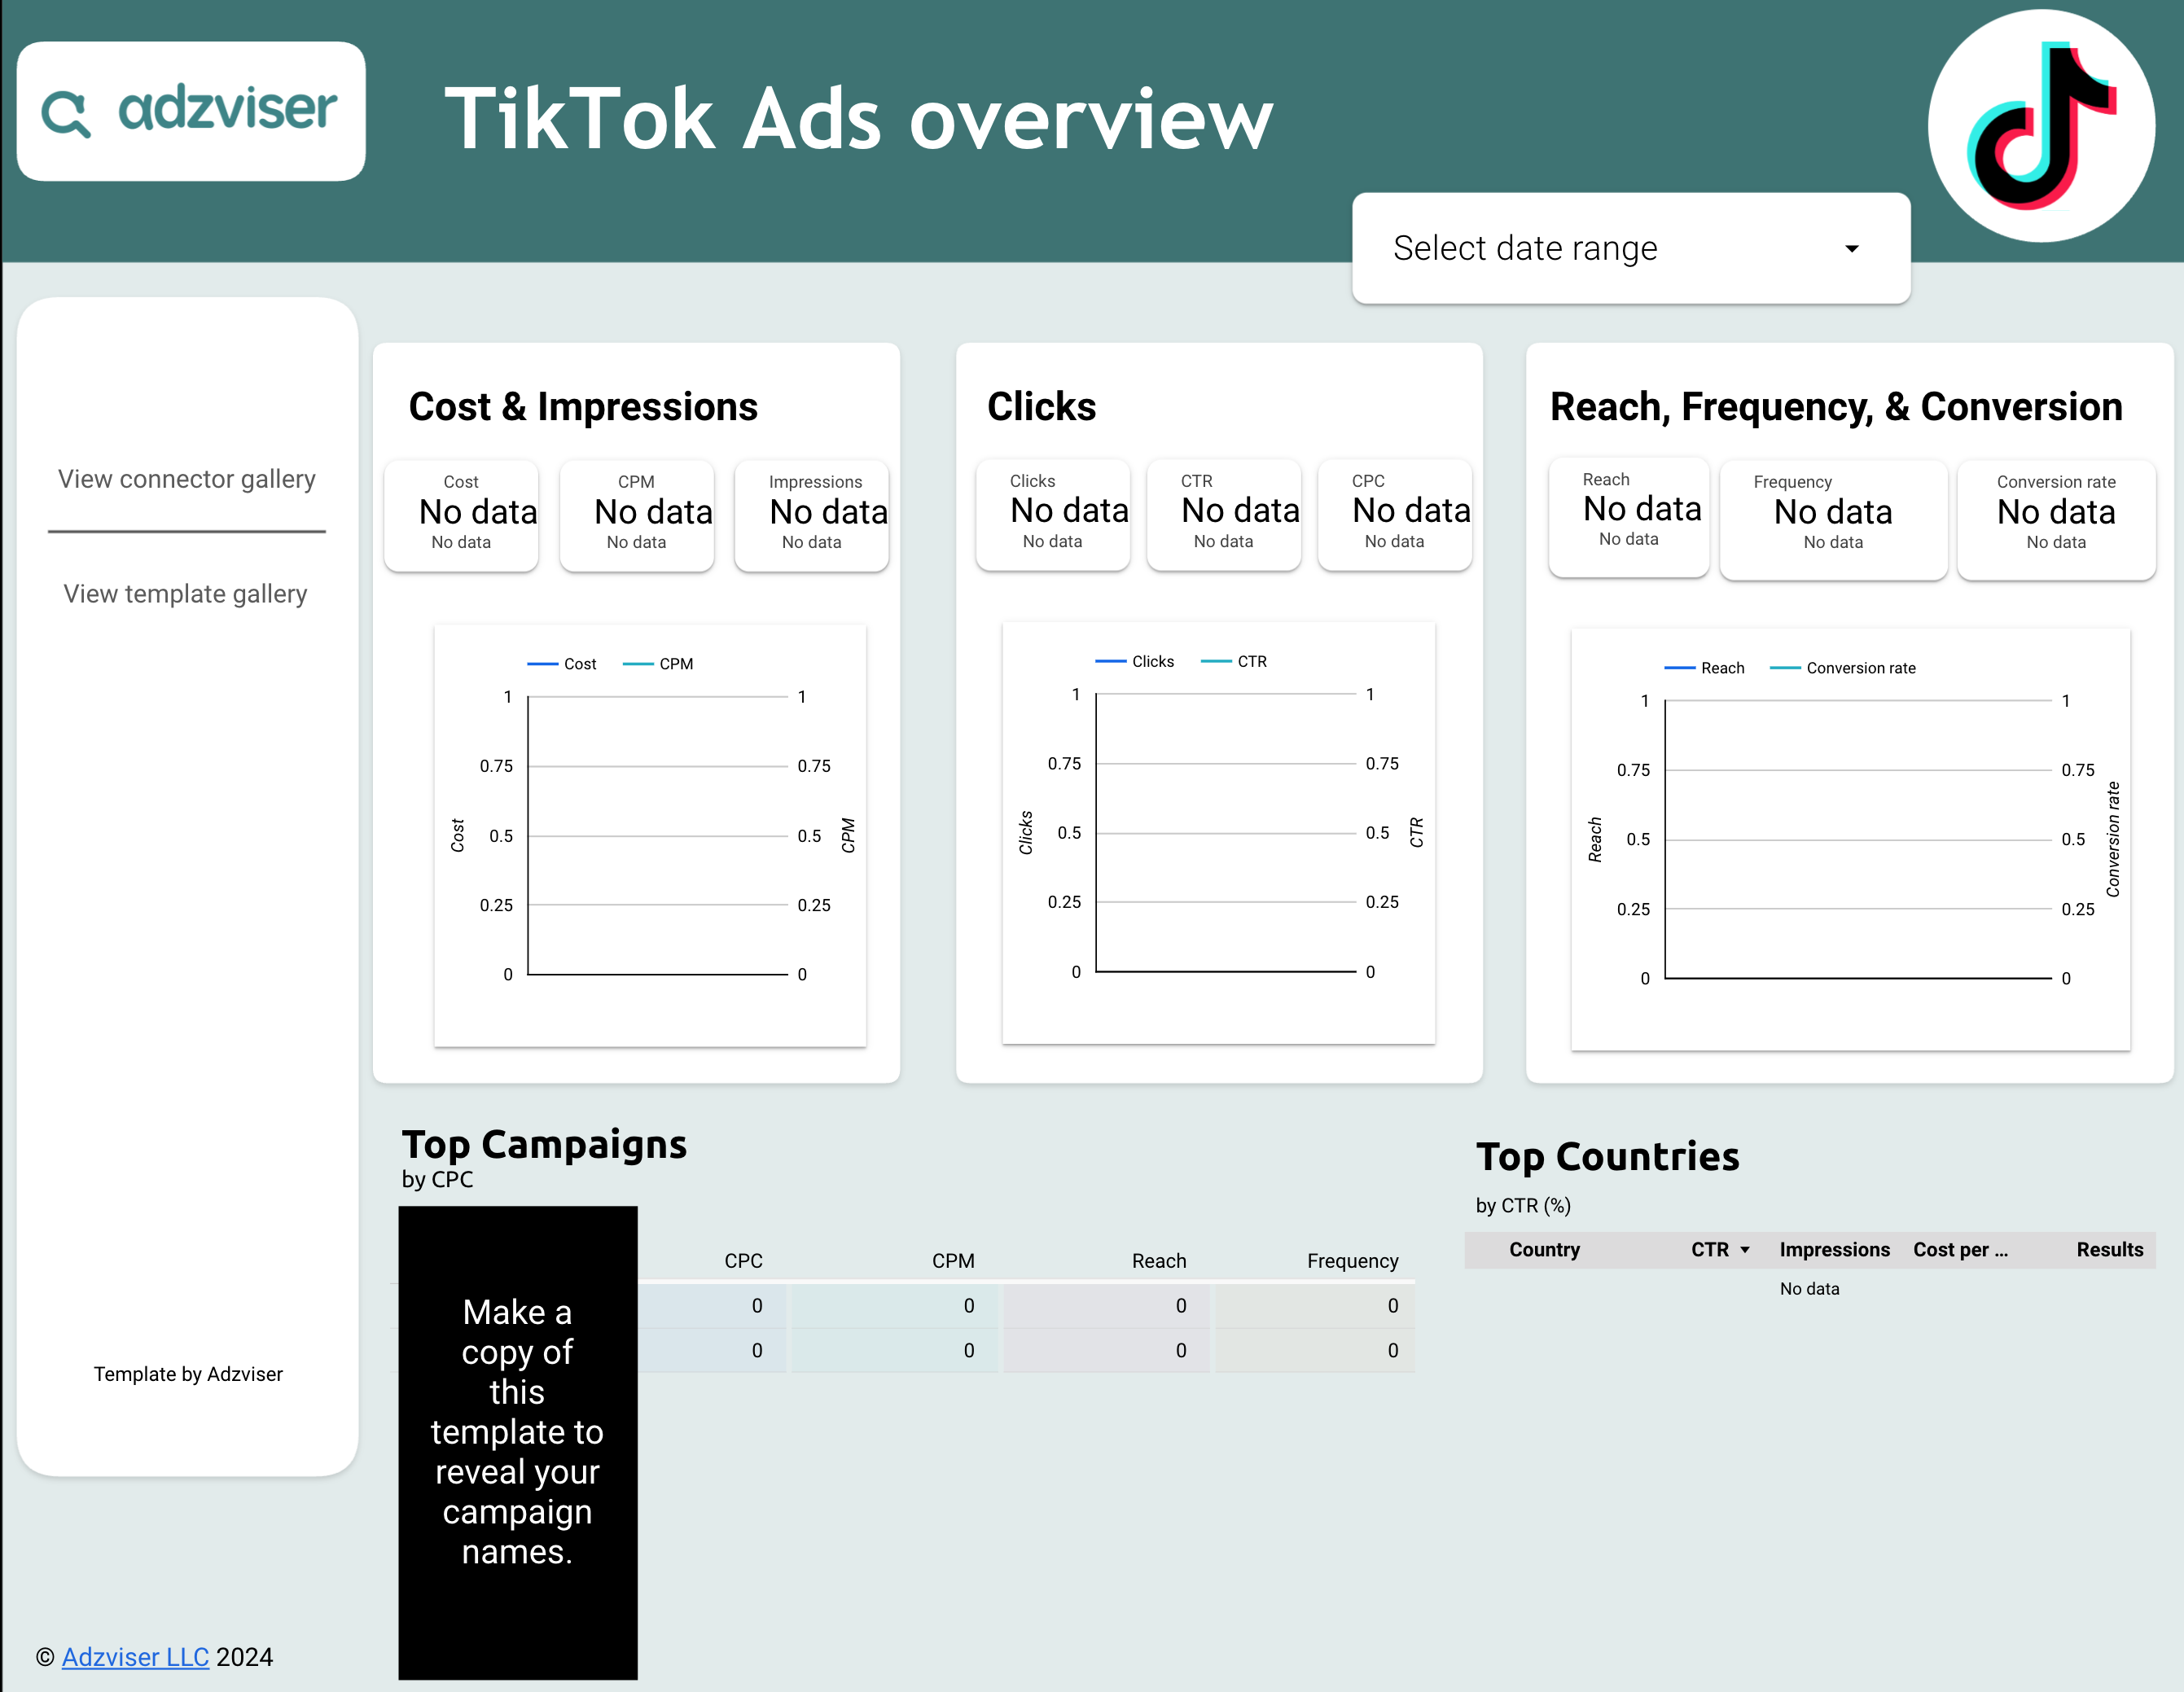
TikTok Ads Overview
A two-page TikTok Ads dashboard for Data Studio — an overview page tracking cost, impressions, clicks, reach, frequency, and conversion rate with top-campaigns and top-countries tables, plus a breakdown page for age, gender, campaign objective, and country by impressions.
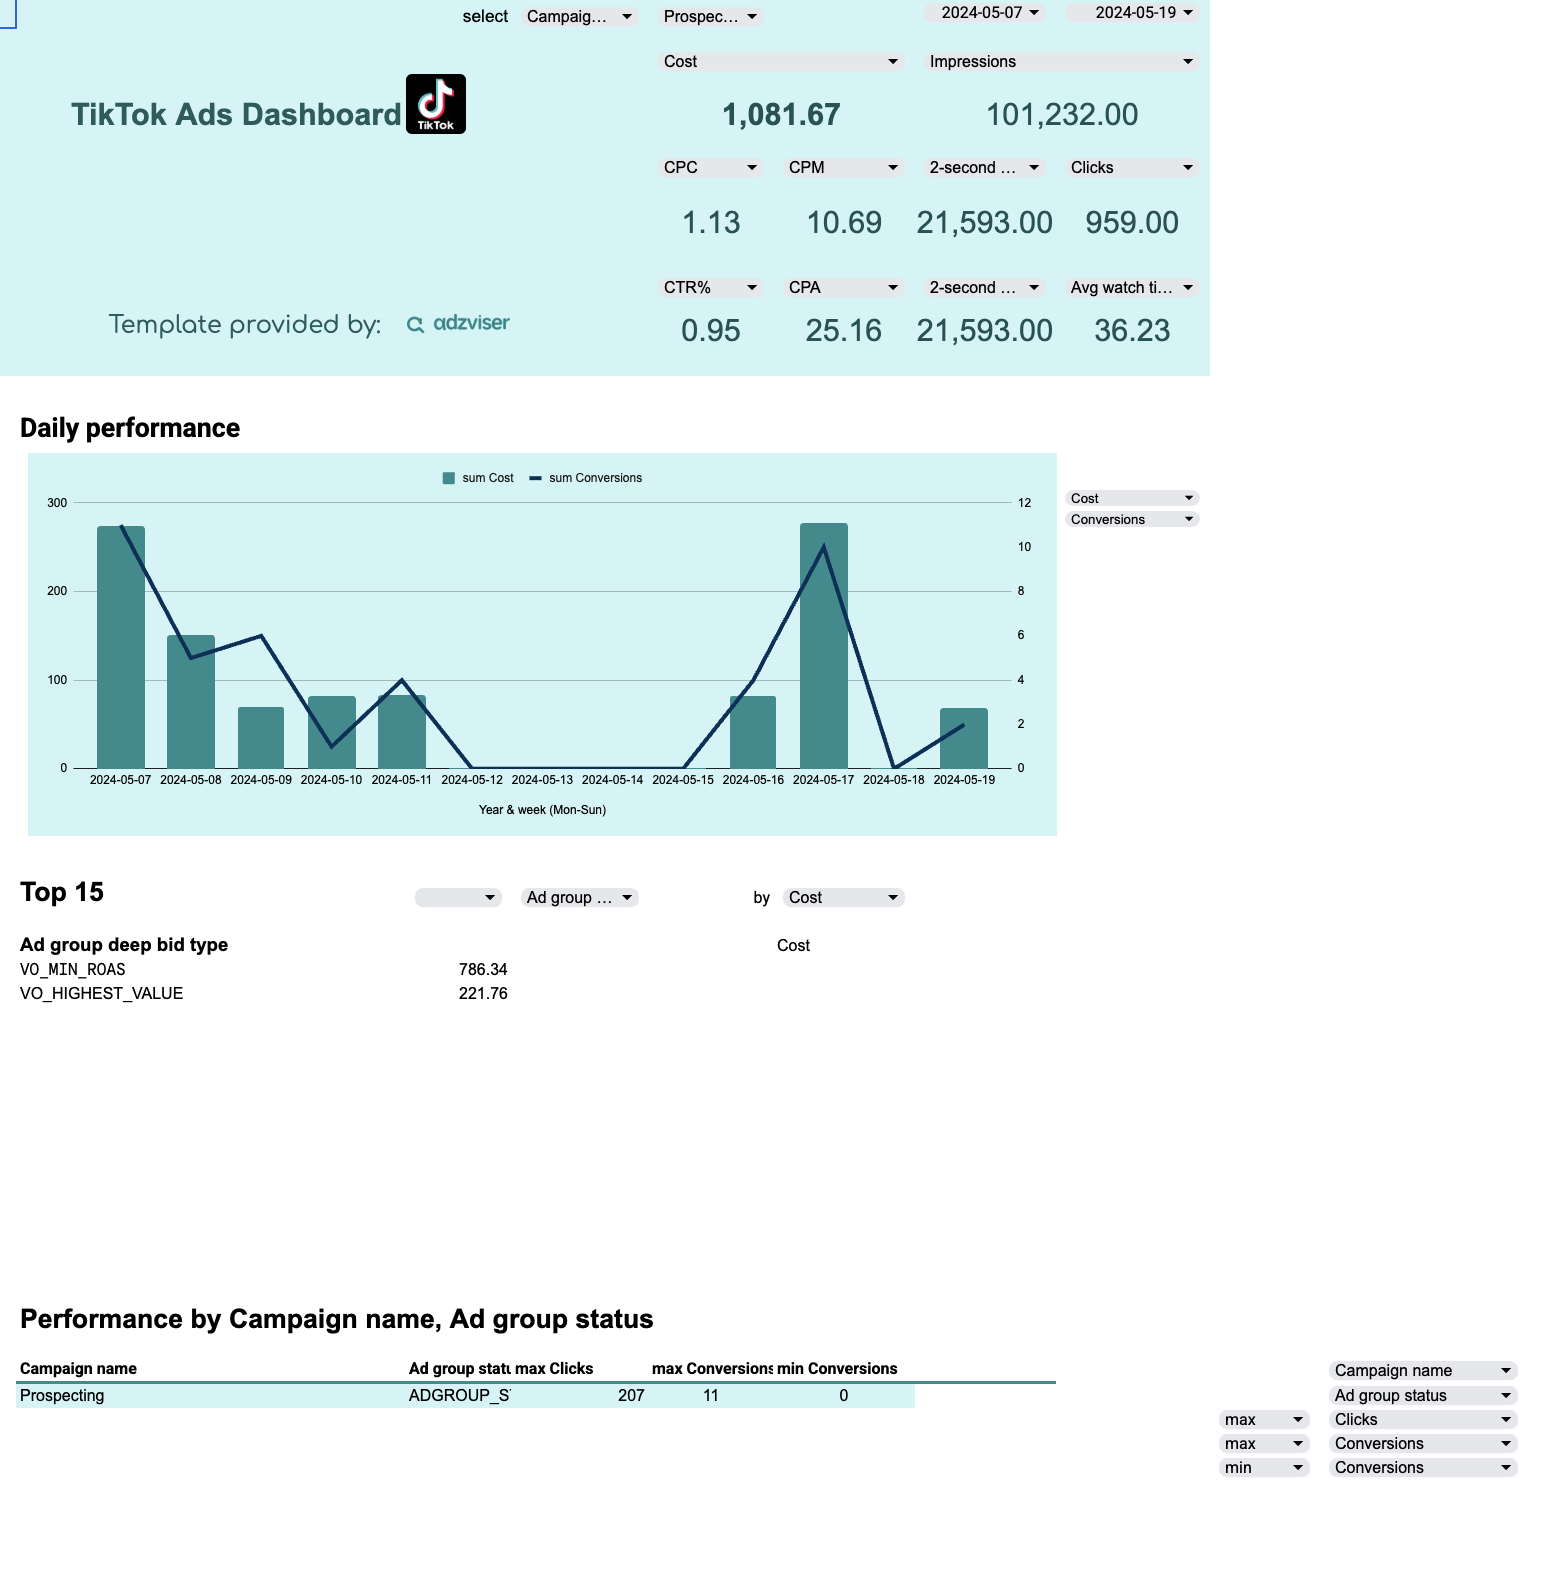
TikTok Ads Report Template
A TikTok Ads report for Google Sheets — track cost, impressions, CPC, CPM, clicks, CTR, CPA, and average watch time at a glance, with a daily performance trend chart and breakdowns by ad group bid type and campaign/ad group status.
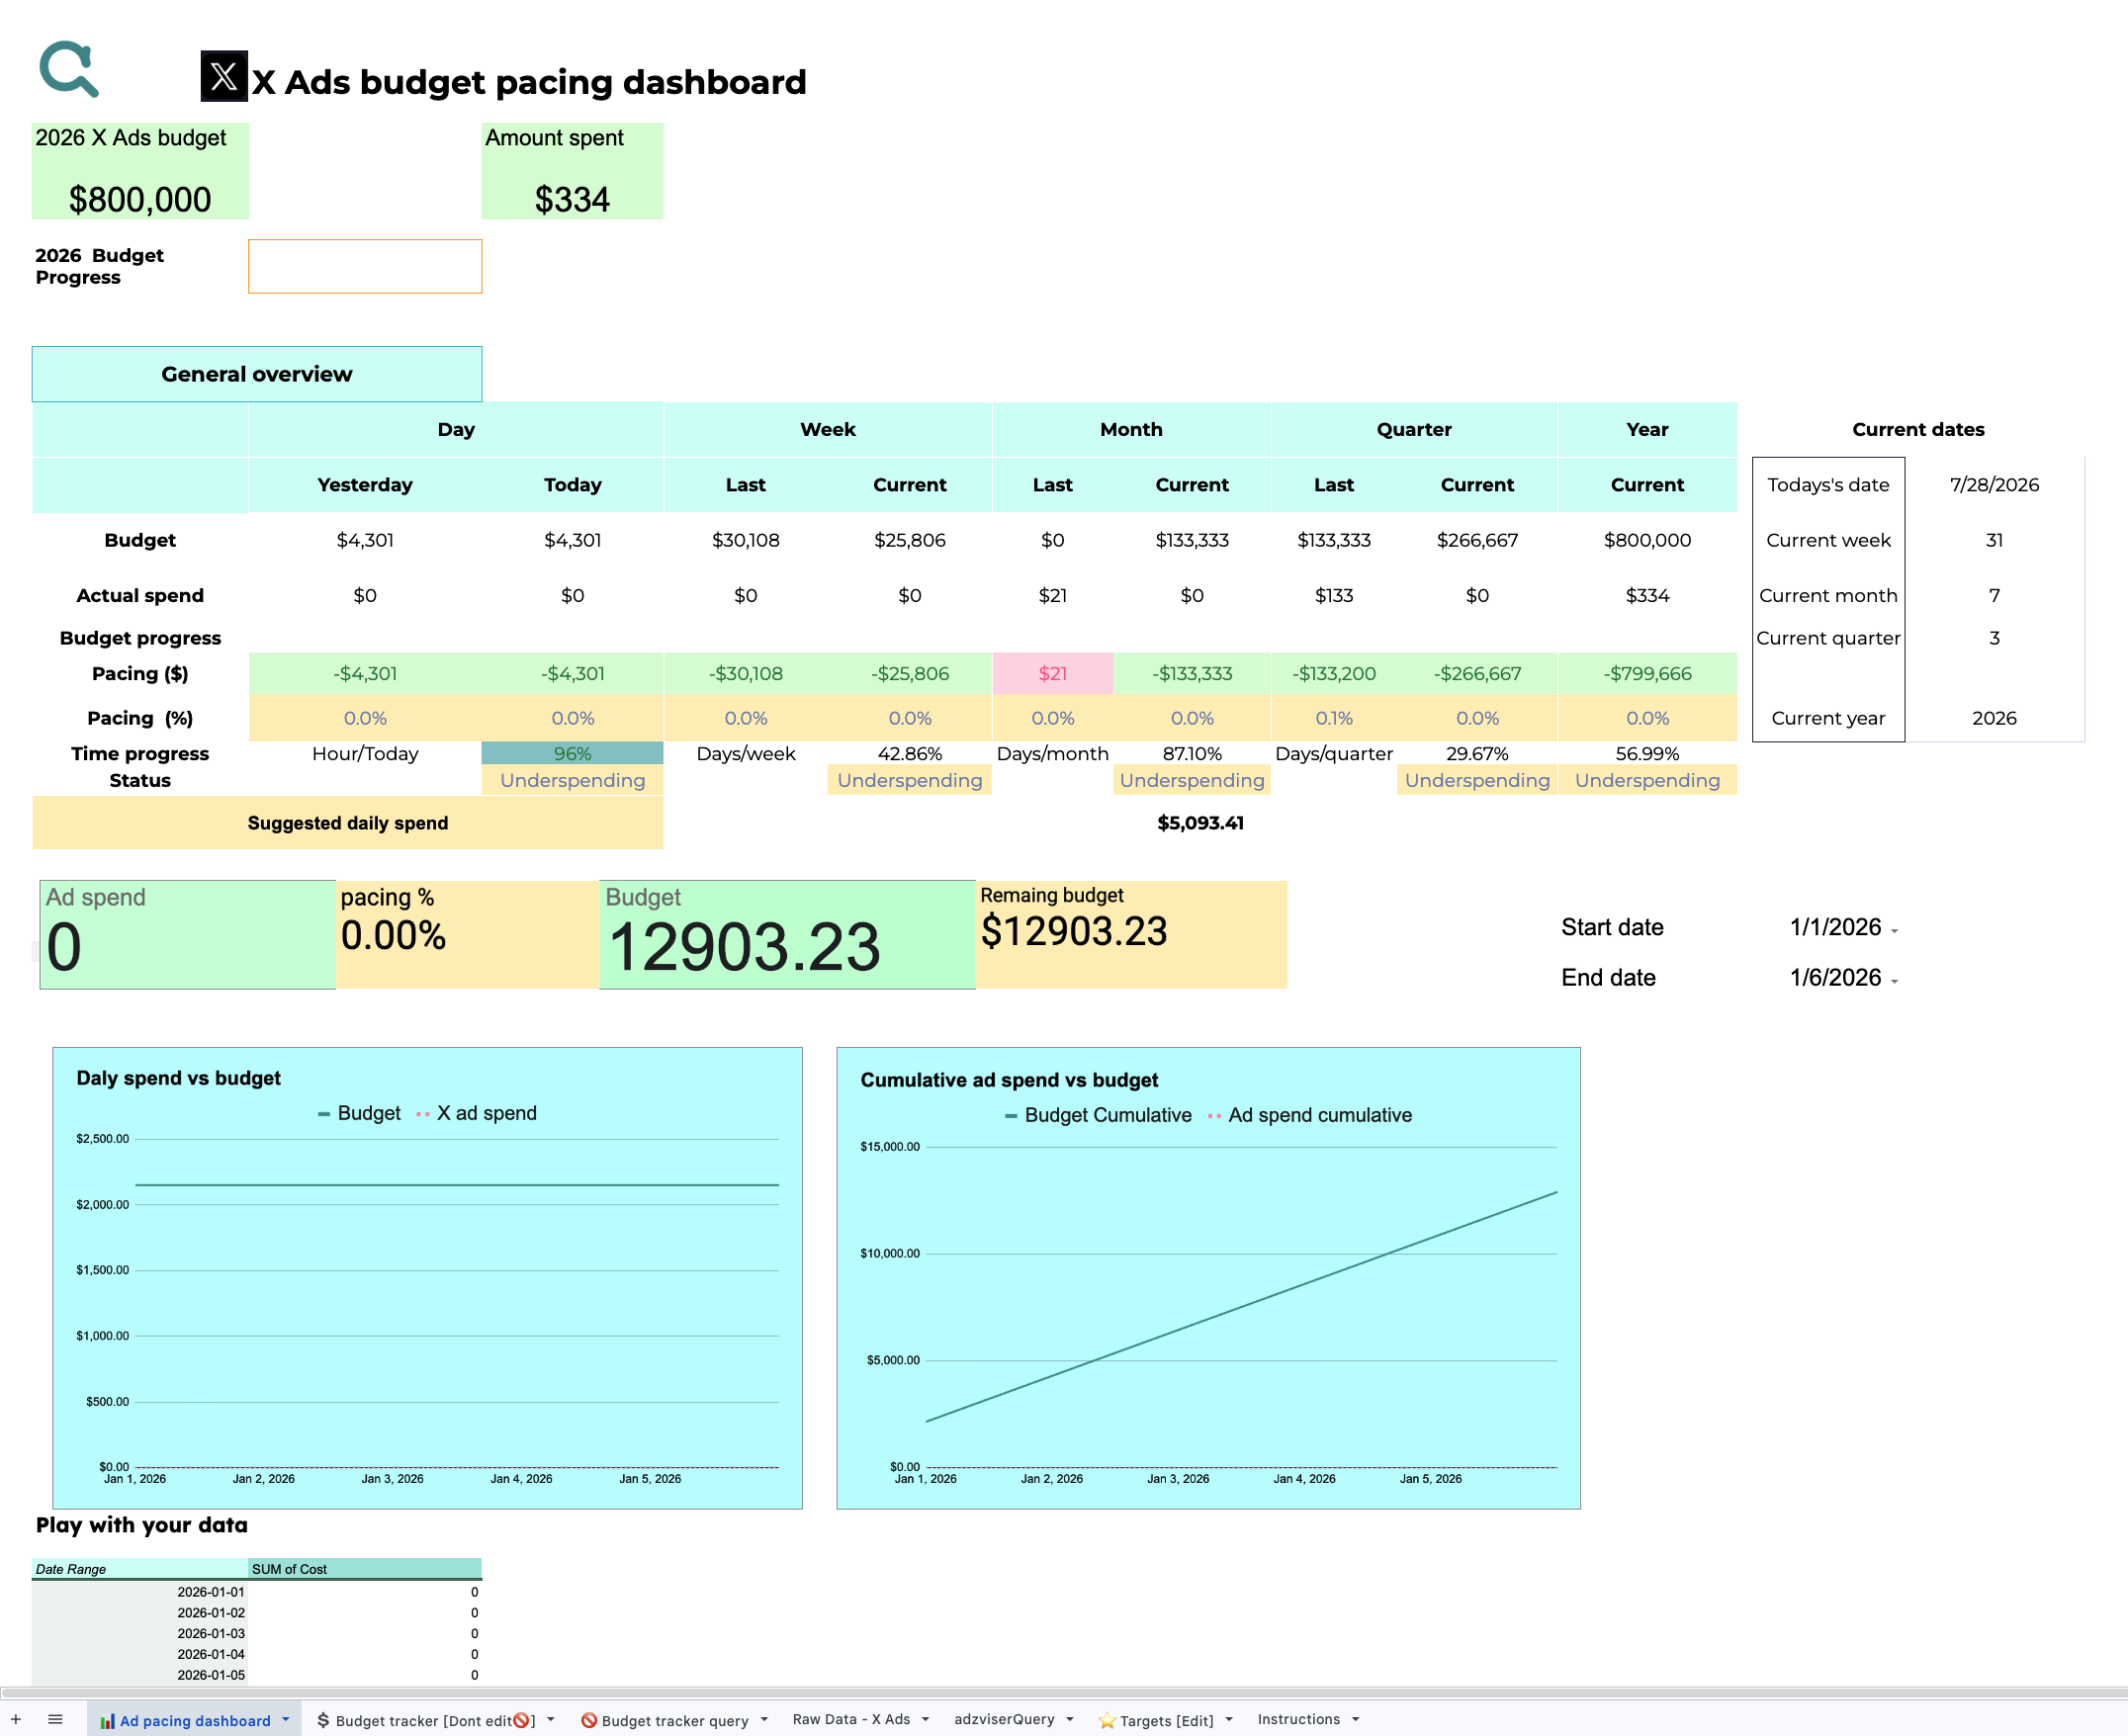

X Ads Budget Pacing Dashboard
Monitor budget pacing across your X Ads campaigns — track spend to date against target budget so you never over- or under-spend.
Use the template where your team already works
Use Data Studio for interactive dashboards and stakeholder reporting, or Google Sheets for formulas, pacing calculations, pivot tables, and operational analysis. Each template connects to supported live data through Adzviser.
Browse Data Studio templates → · Browse Google Sheets templates →