Start with the right KPIs
Use a report structure designed around the source's practical campaign, audience, conversion, sales, or engagement metrics.
Copy a professionally designed Data Studio dashboard, connect your marketing data through Adzviser, and turn campaign, CRM, analytics, or e-commerce metrics into a report you can share.
Choose a dashboard built for the source you report on. Each collection includes a reusable Data Studio report layout and a direct path to connecting live data.
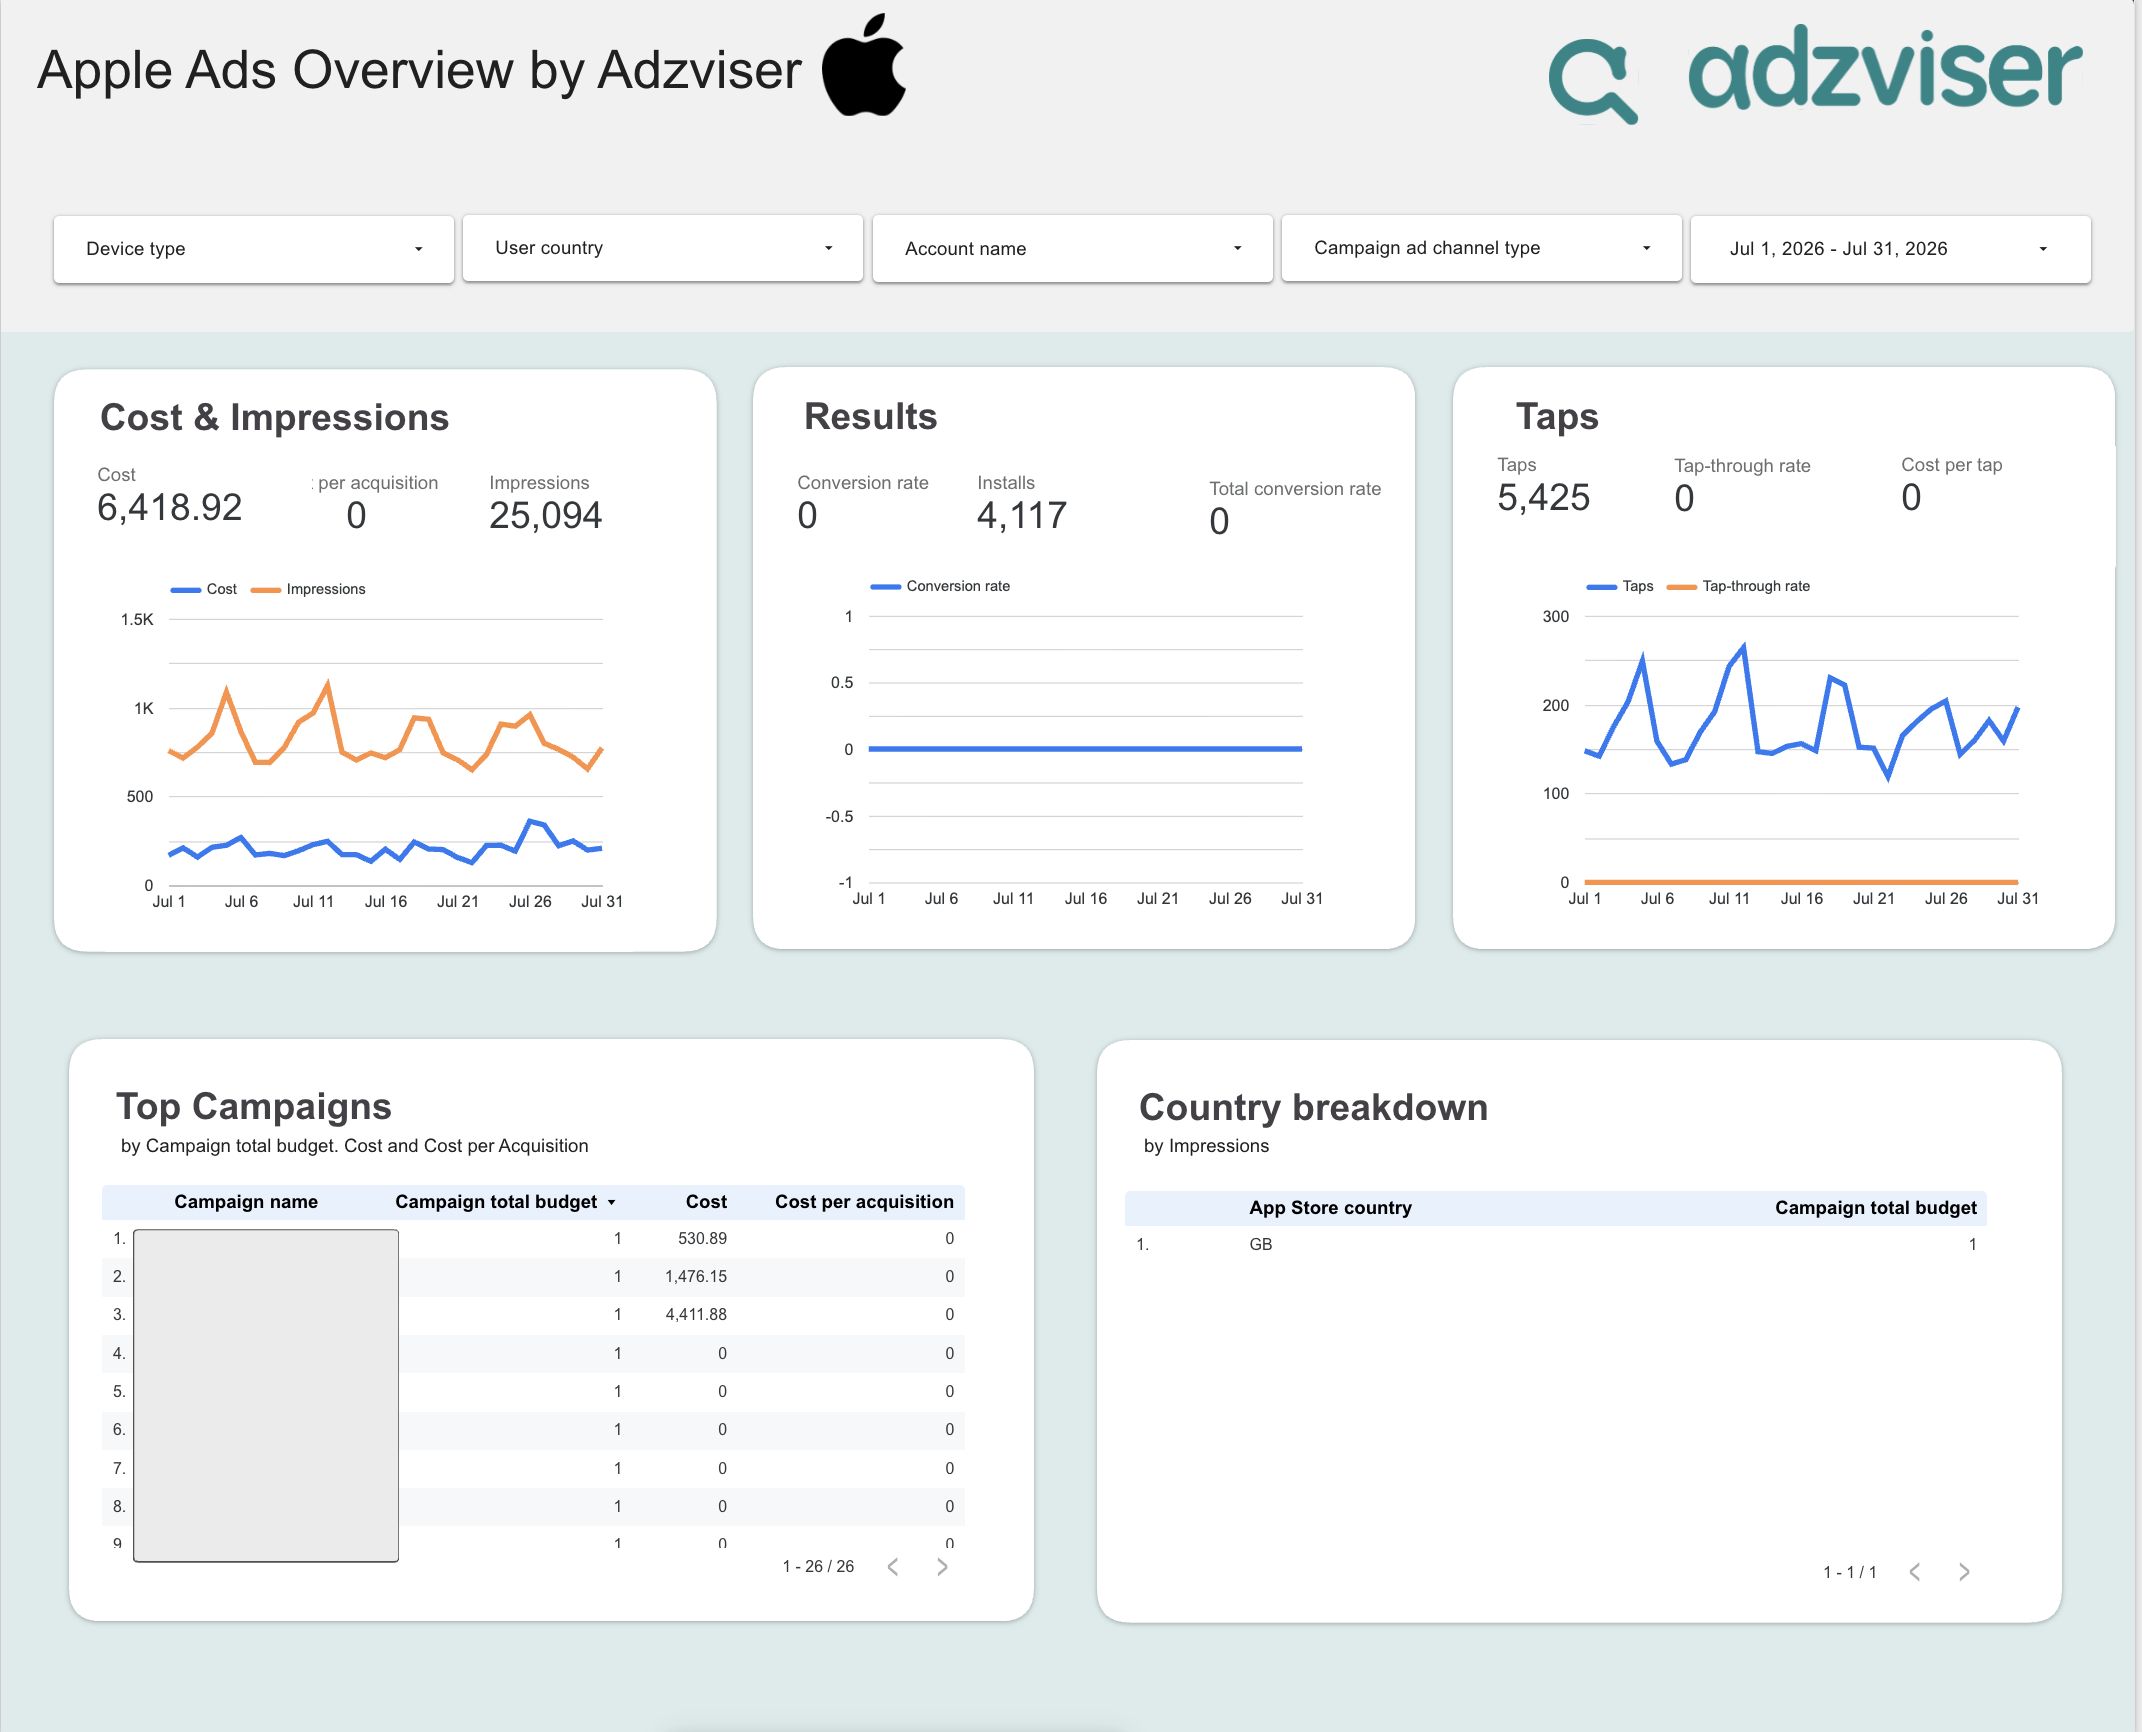
 +
+
1 ready-to-use template for Apple Ads
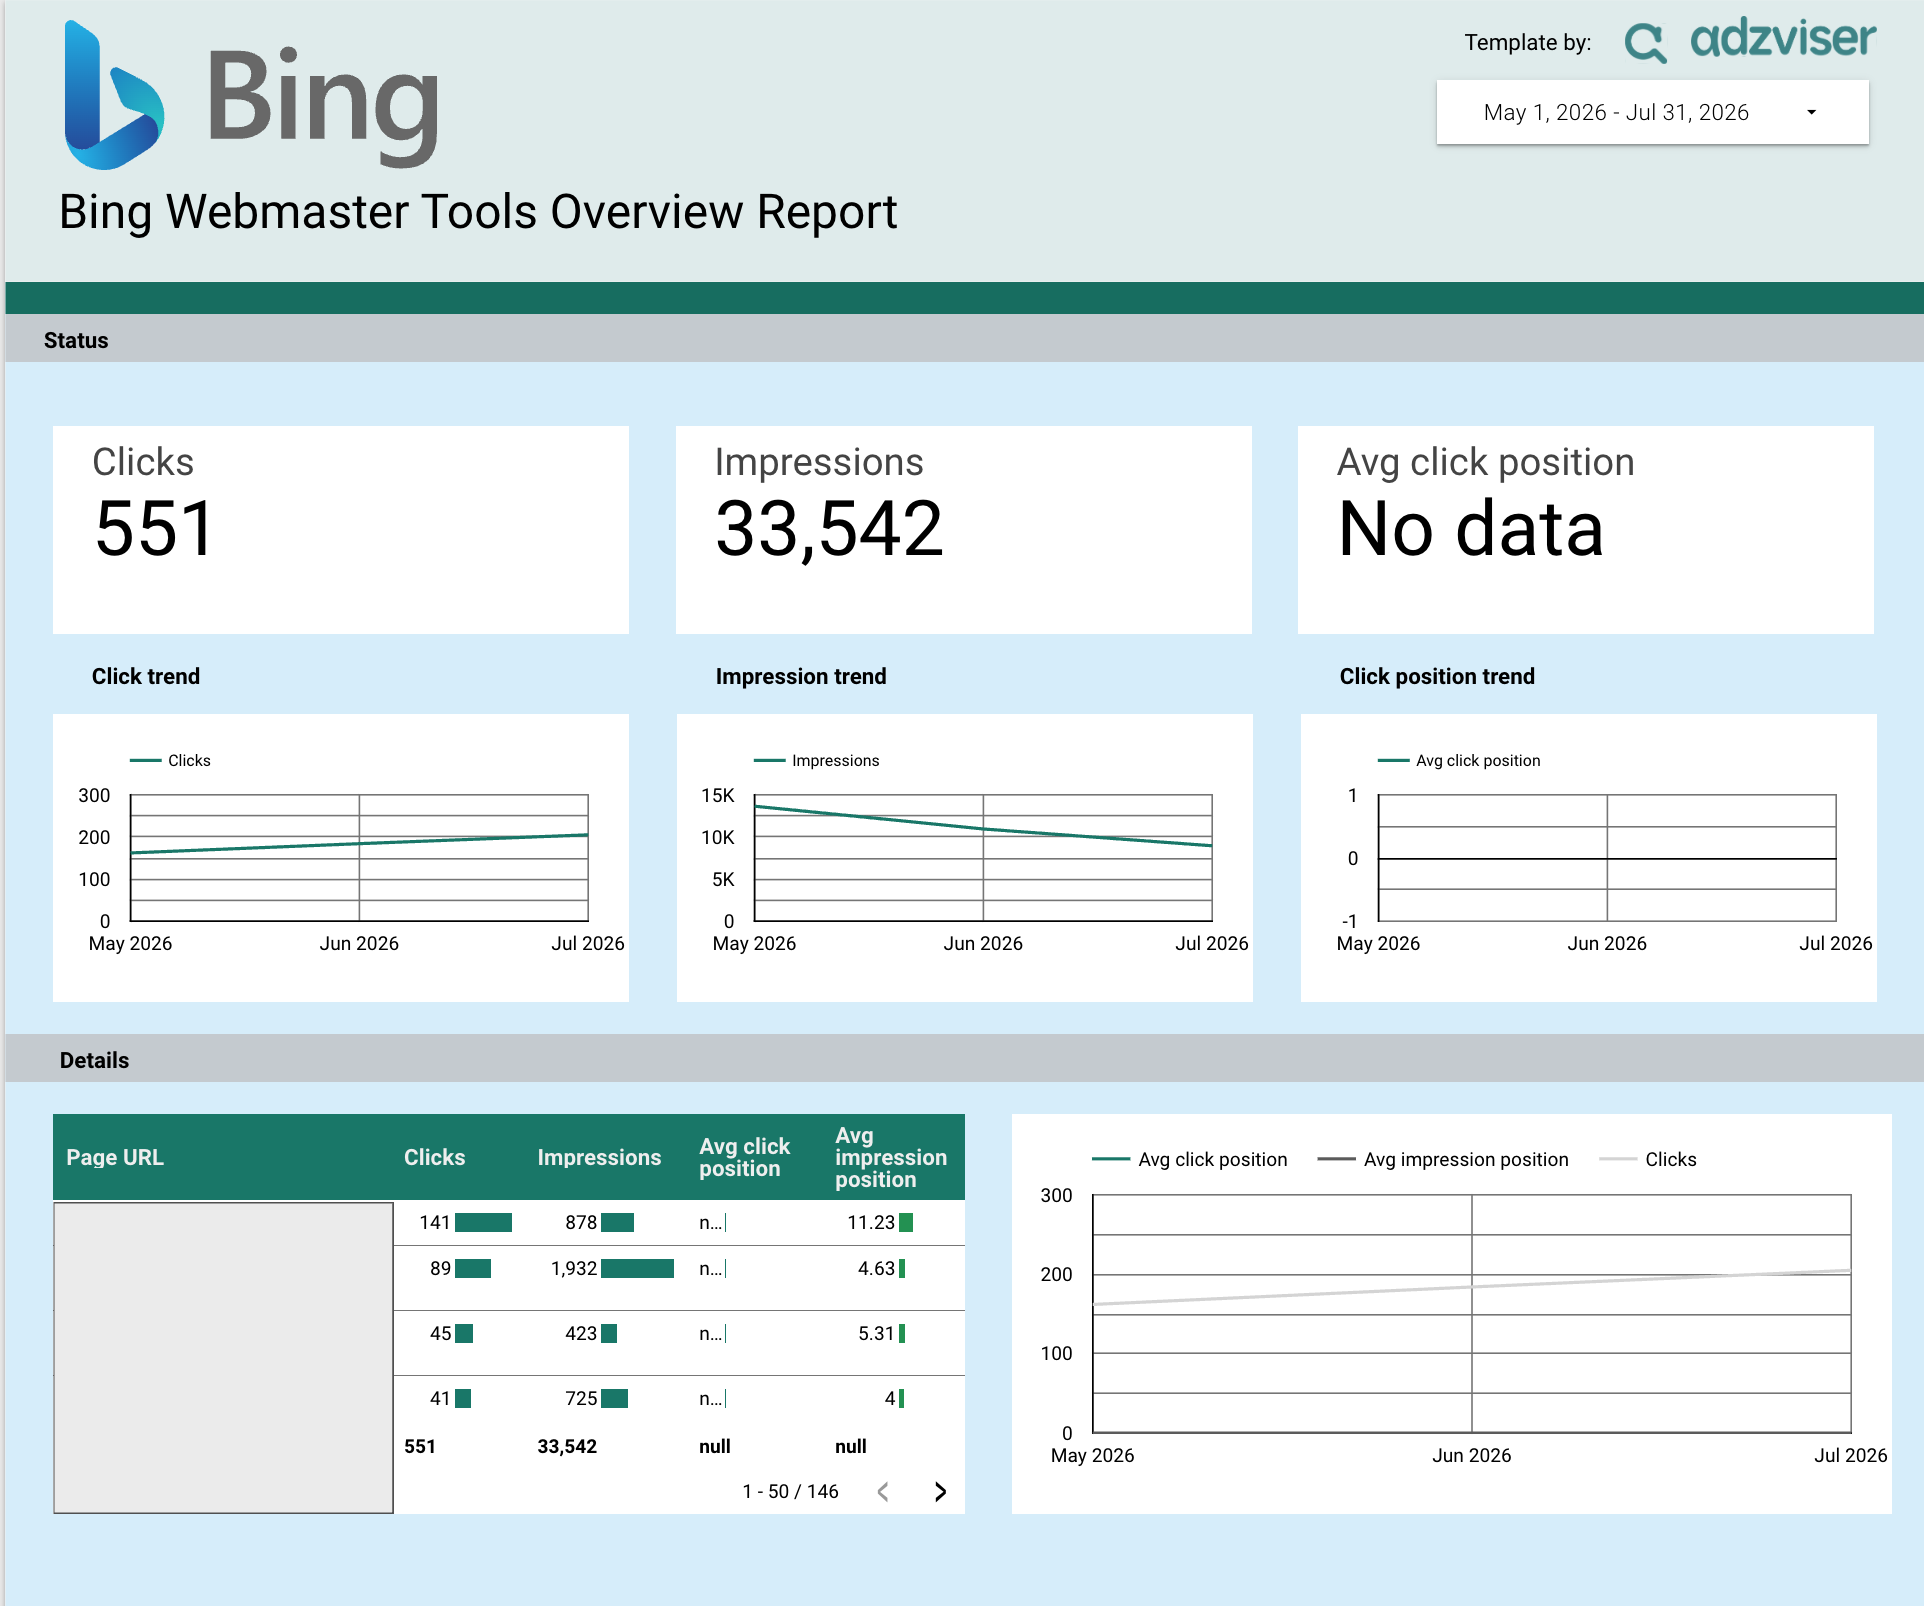
 +
+1 ready-to-use template for Bing Webmaster Tools
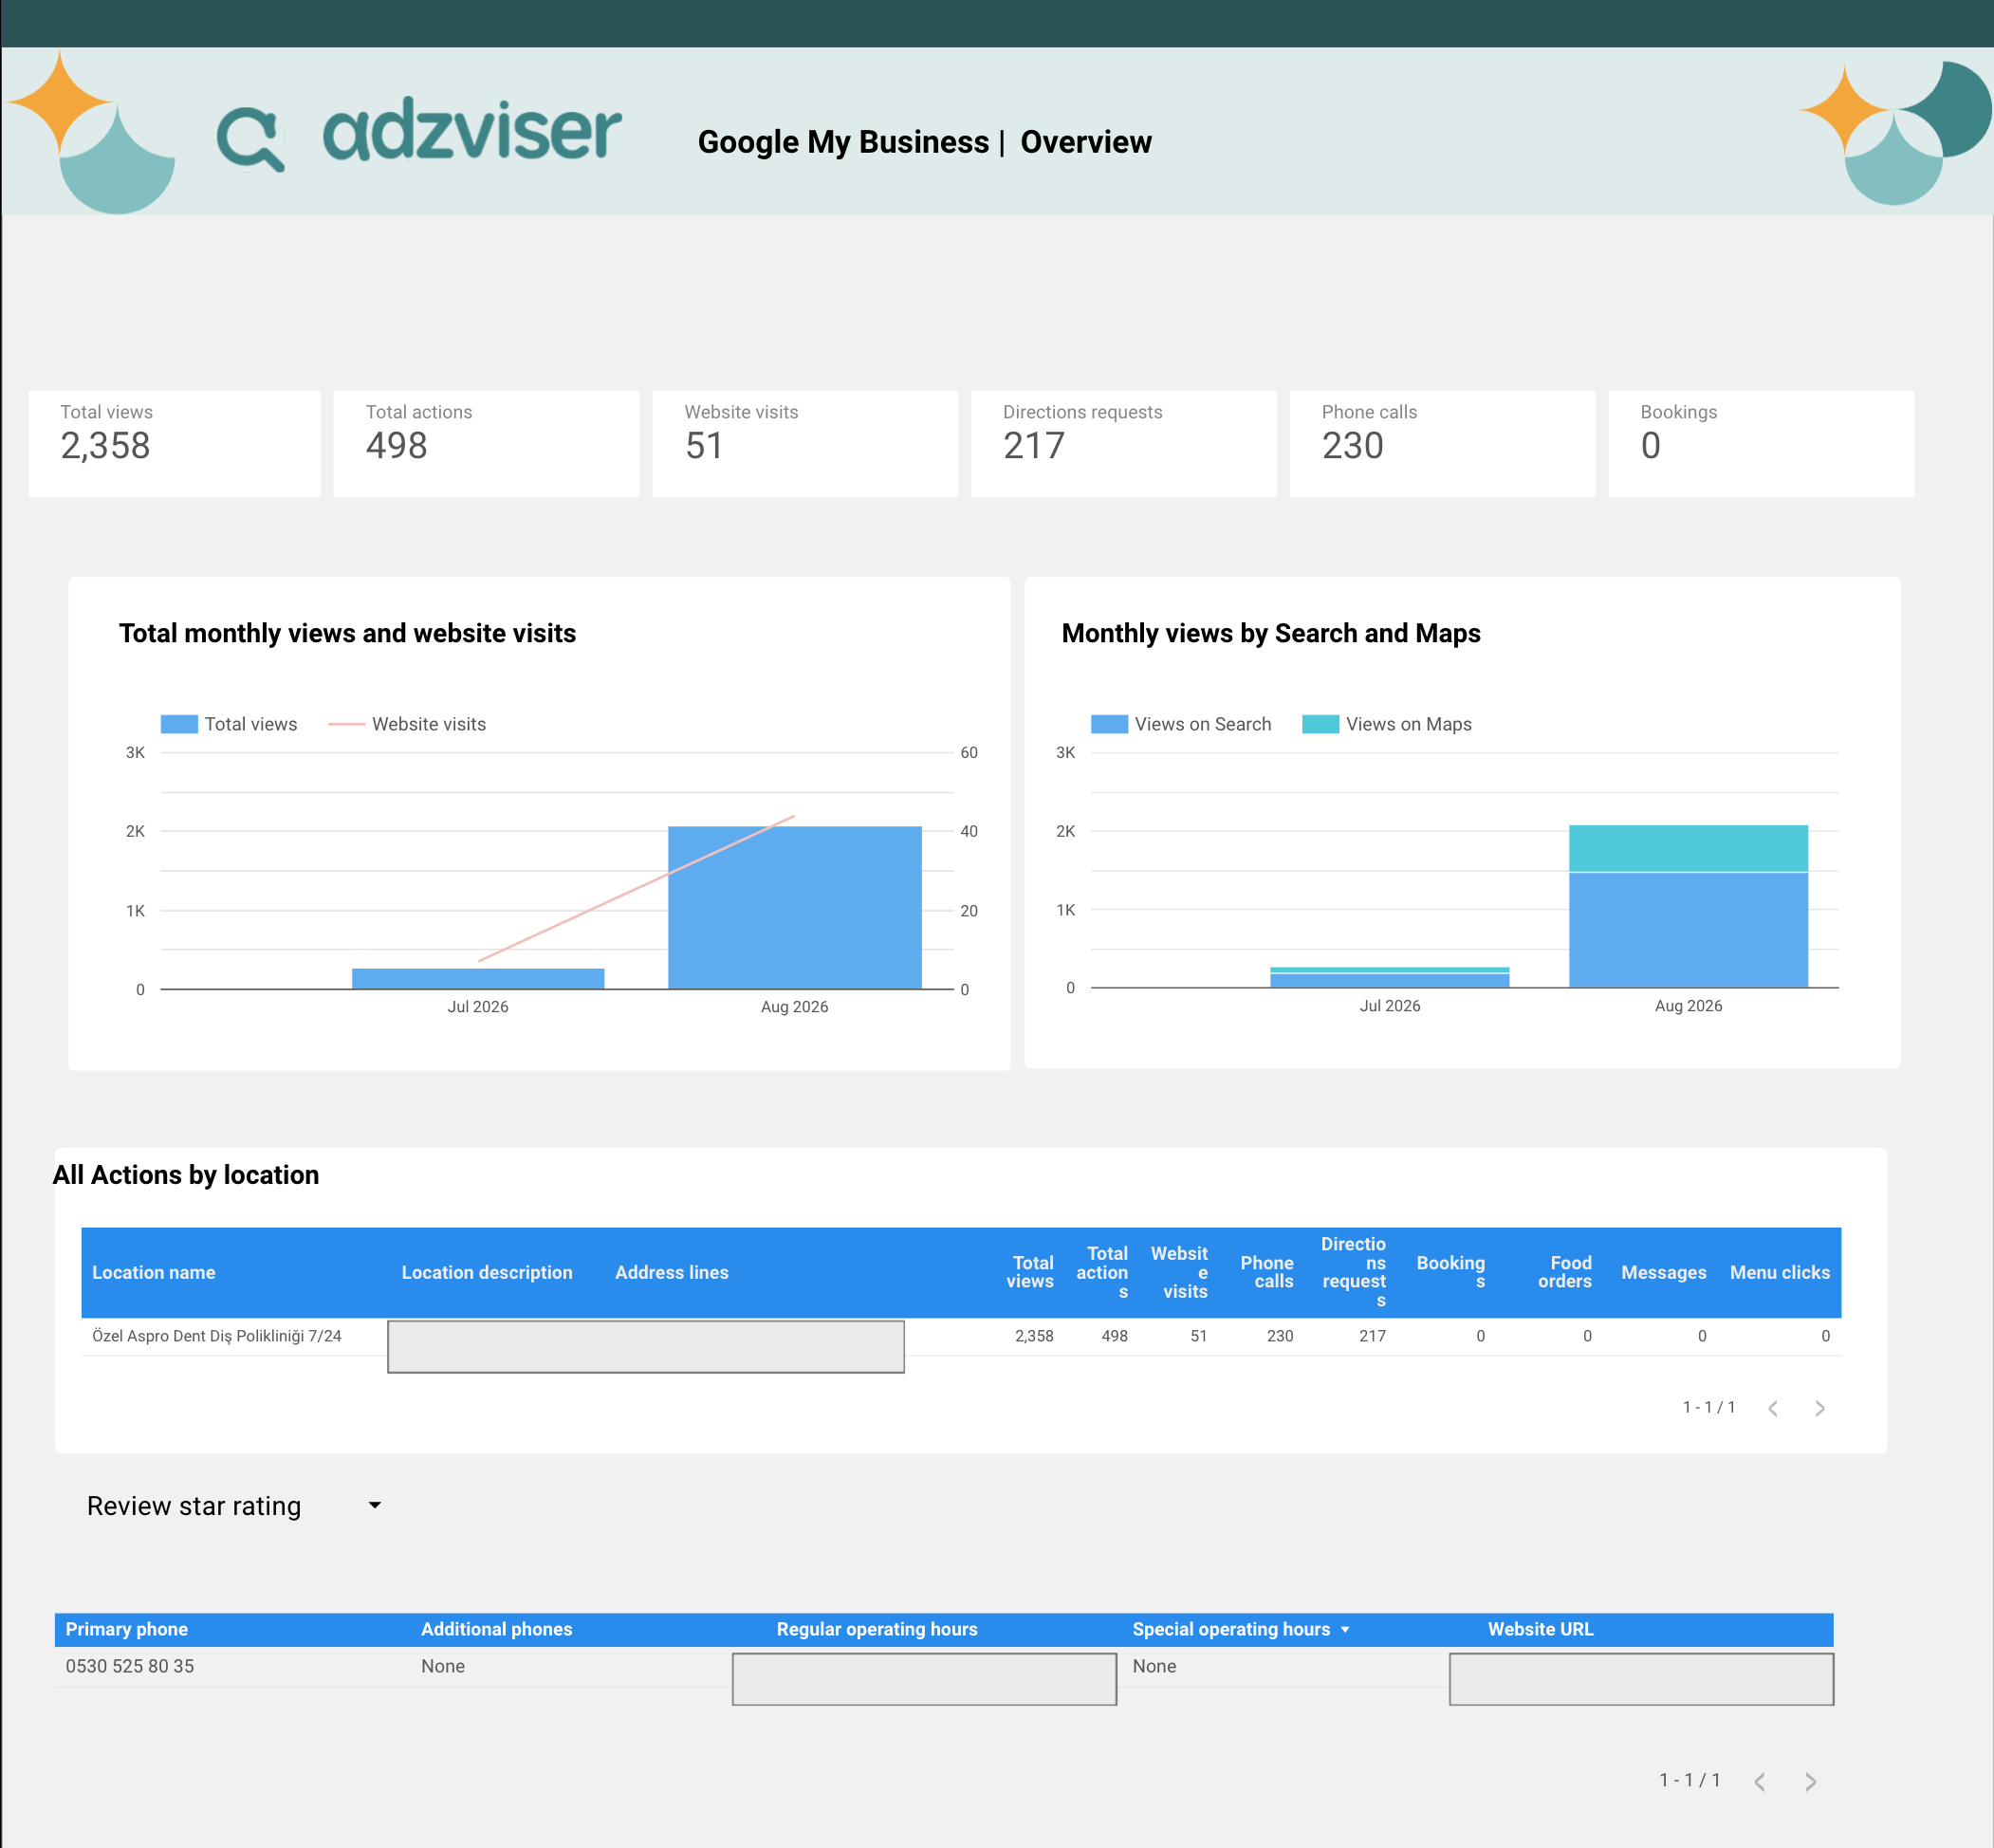
 +
+1 ready-to-use template for Business Profile
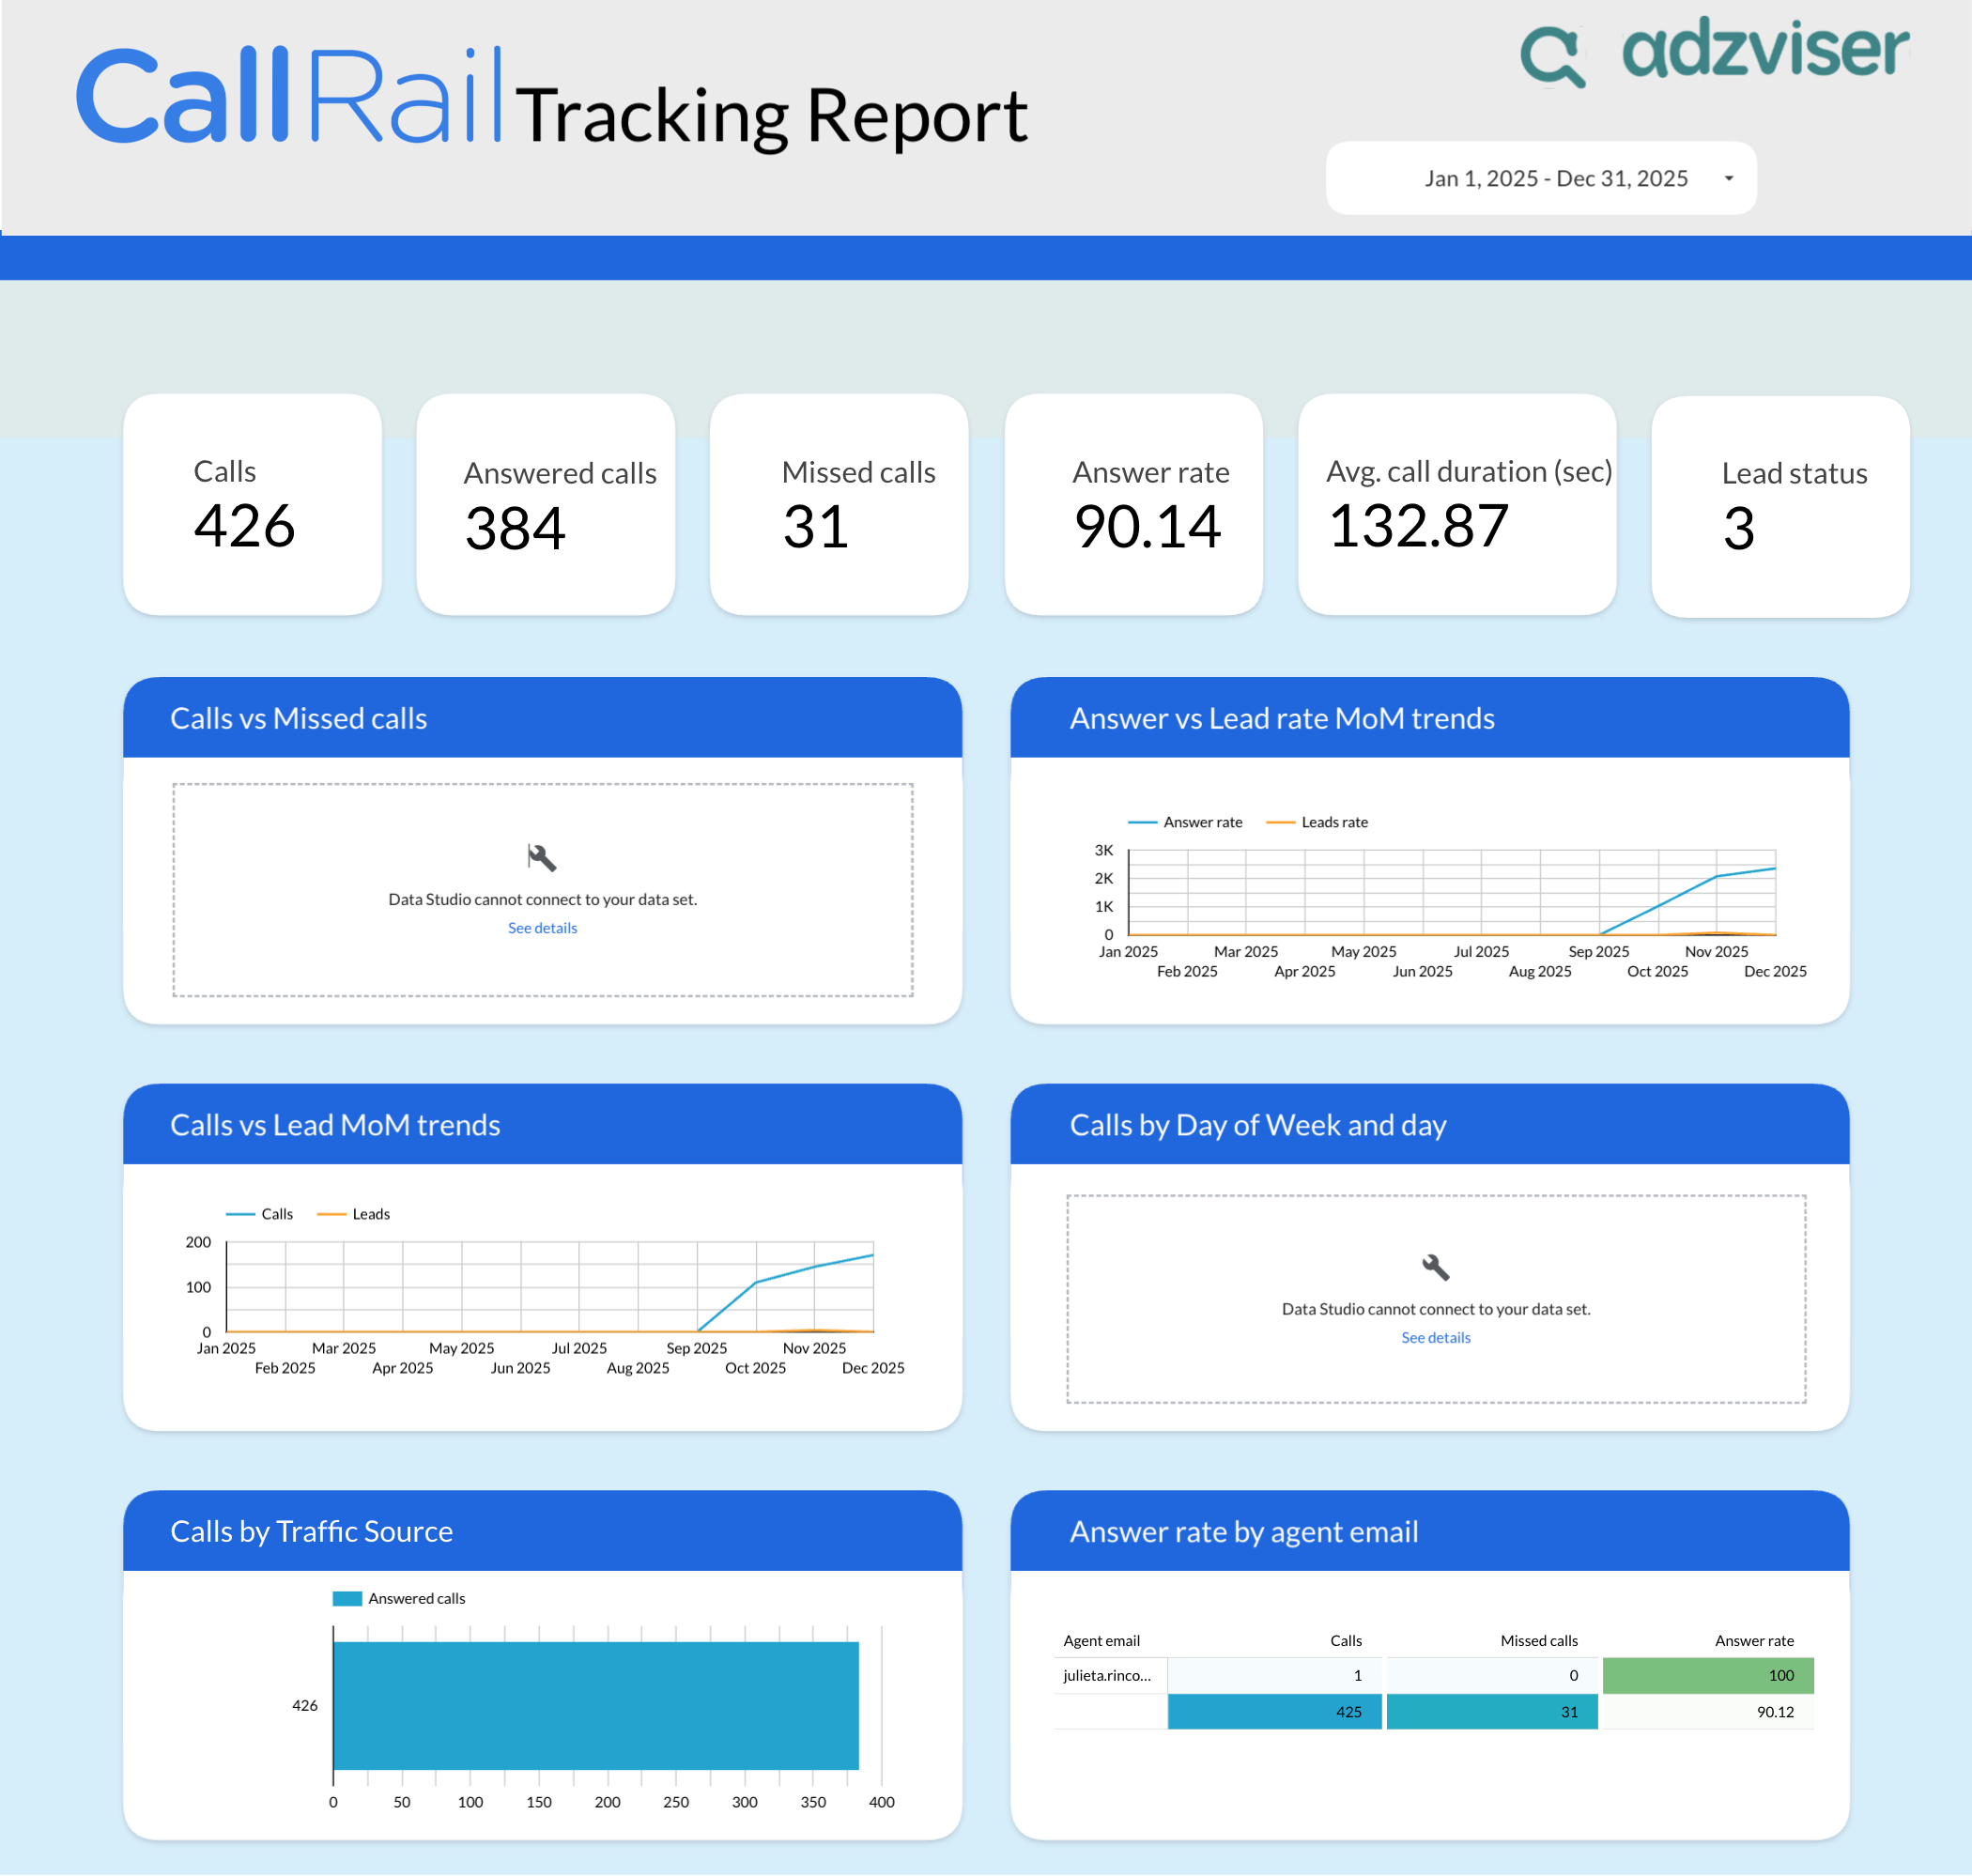
 +
+1 ready-to-use template for CallRail
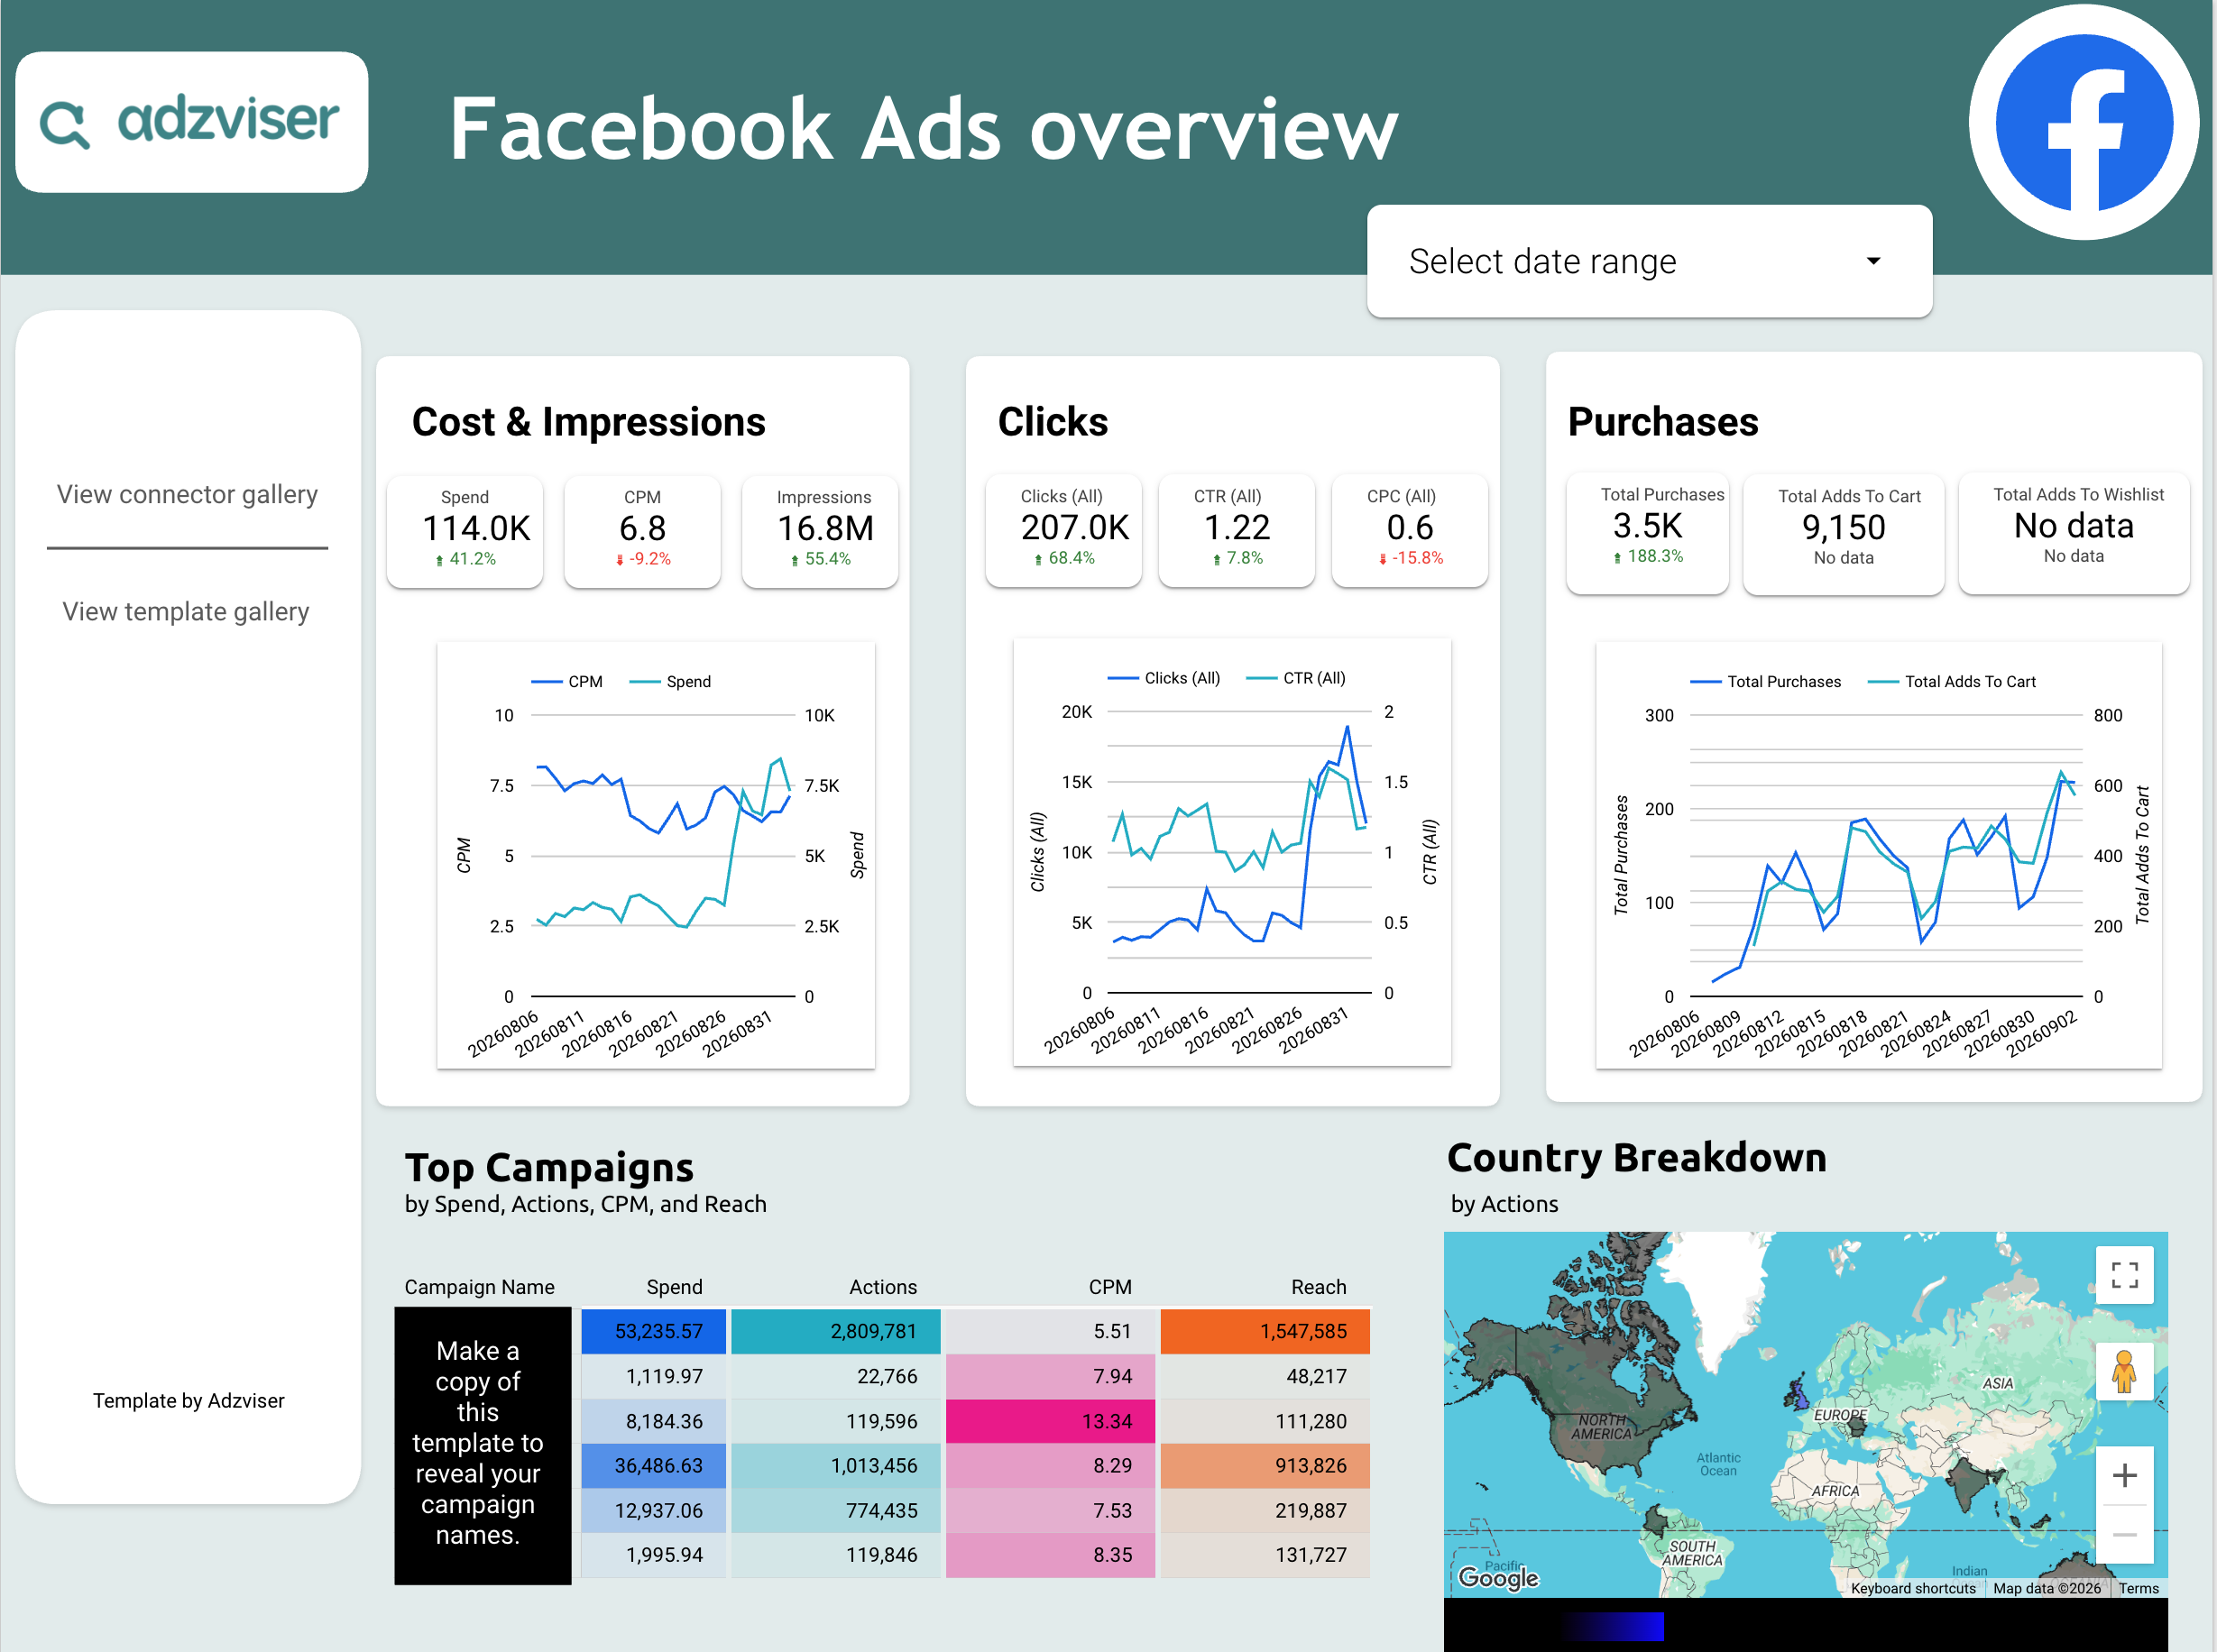
 +
+2 ready-to-use templates for Facebook Ads
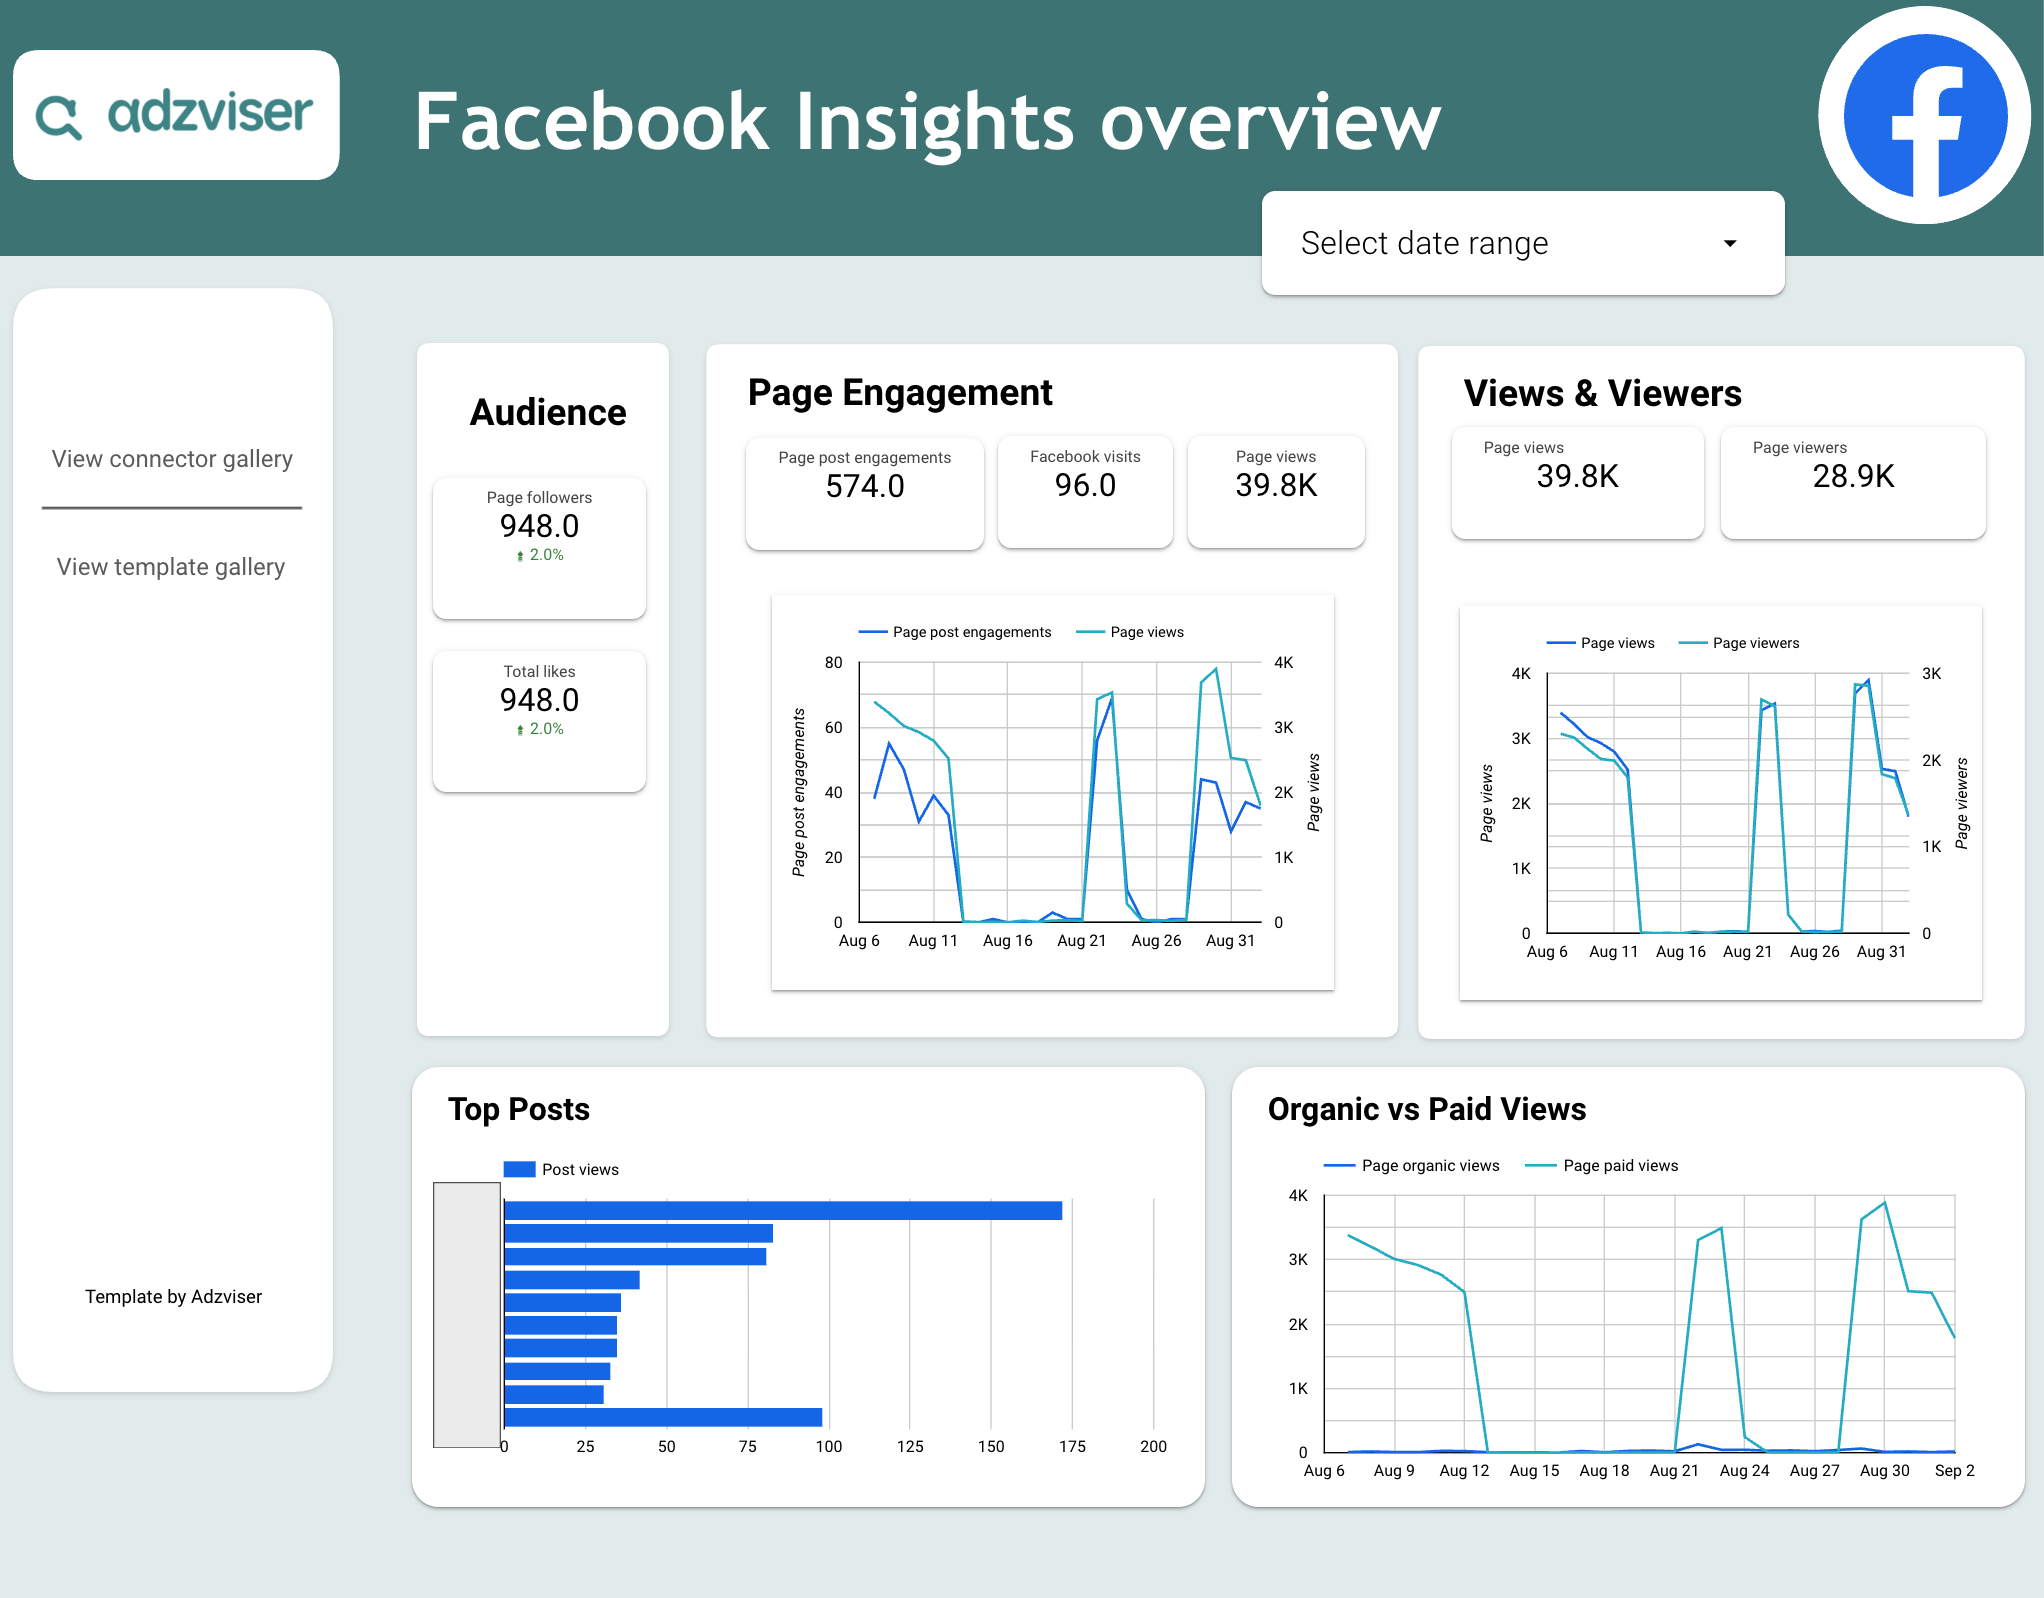 +
+1 ready-to-use template for Facebook Insights
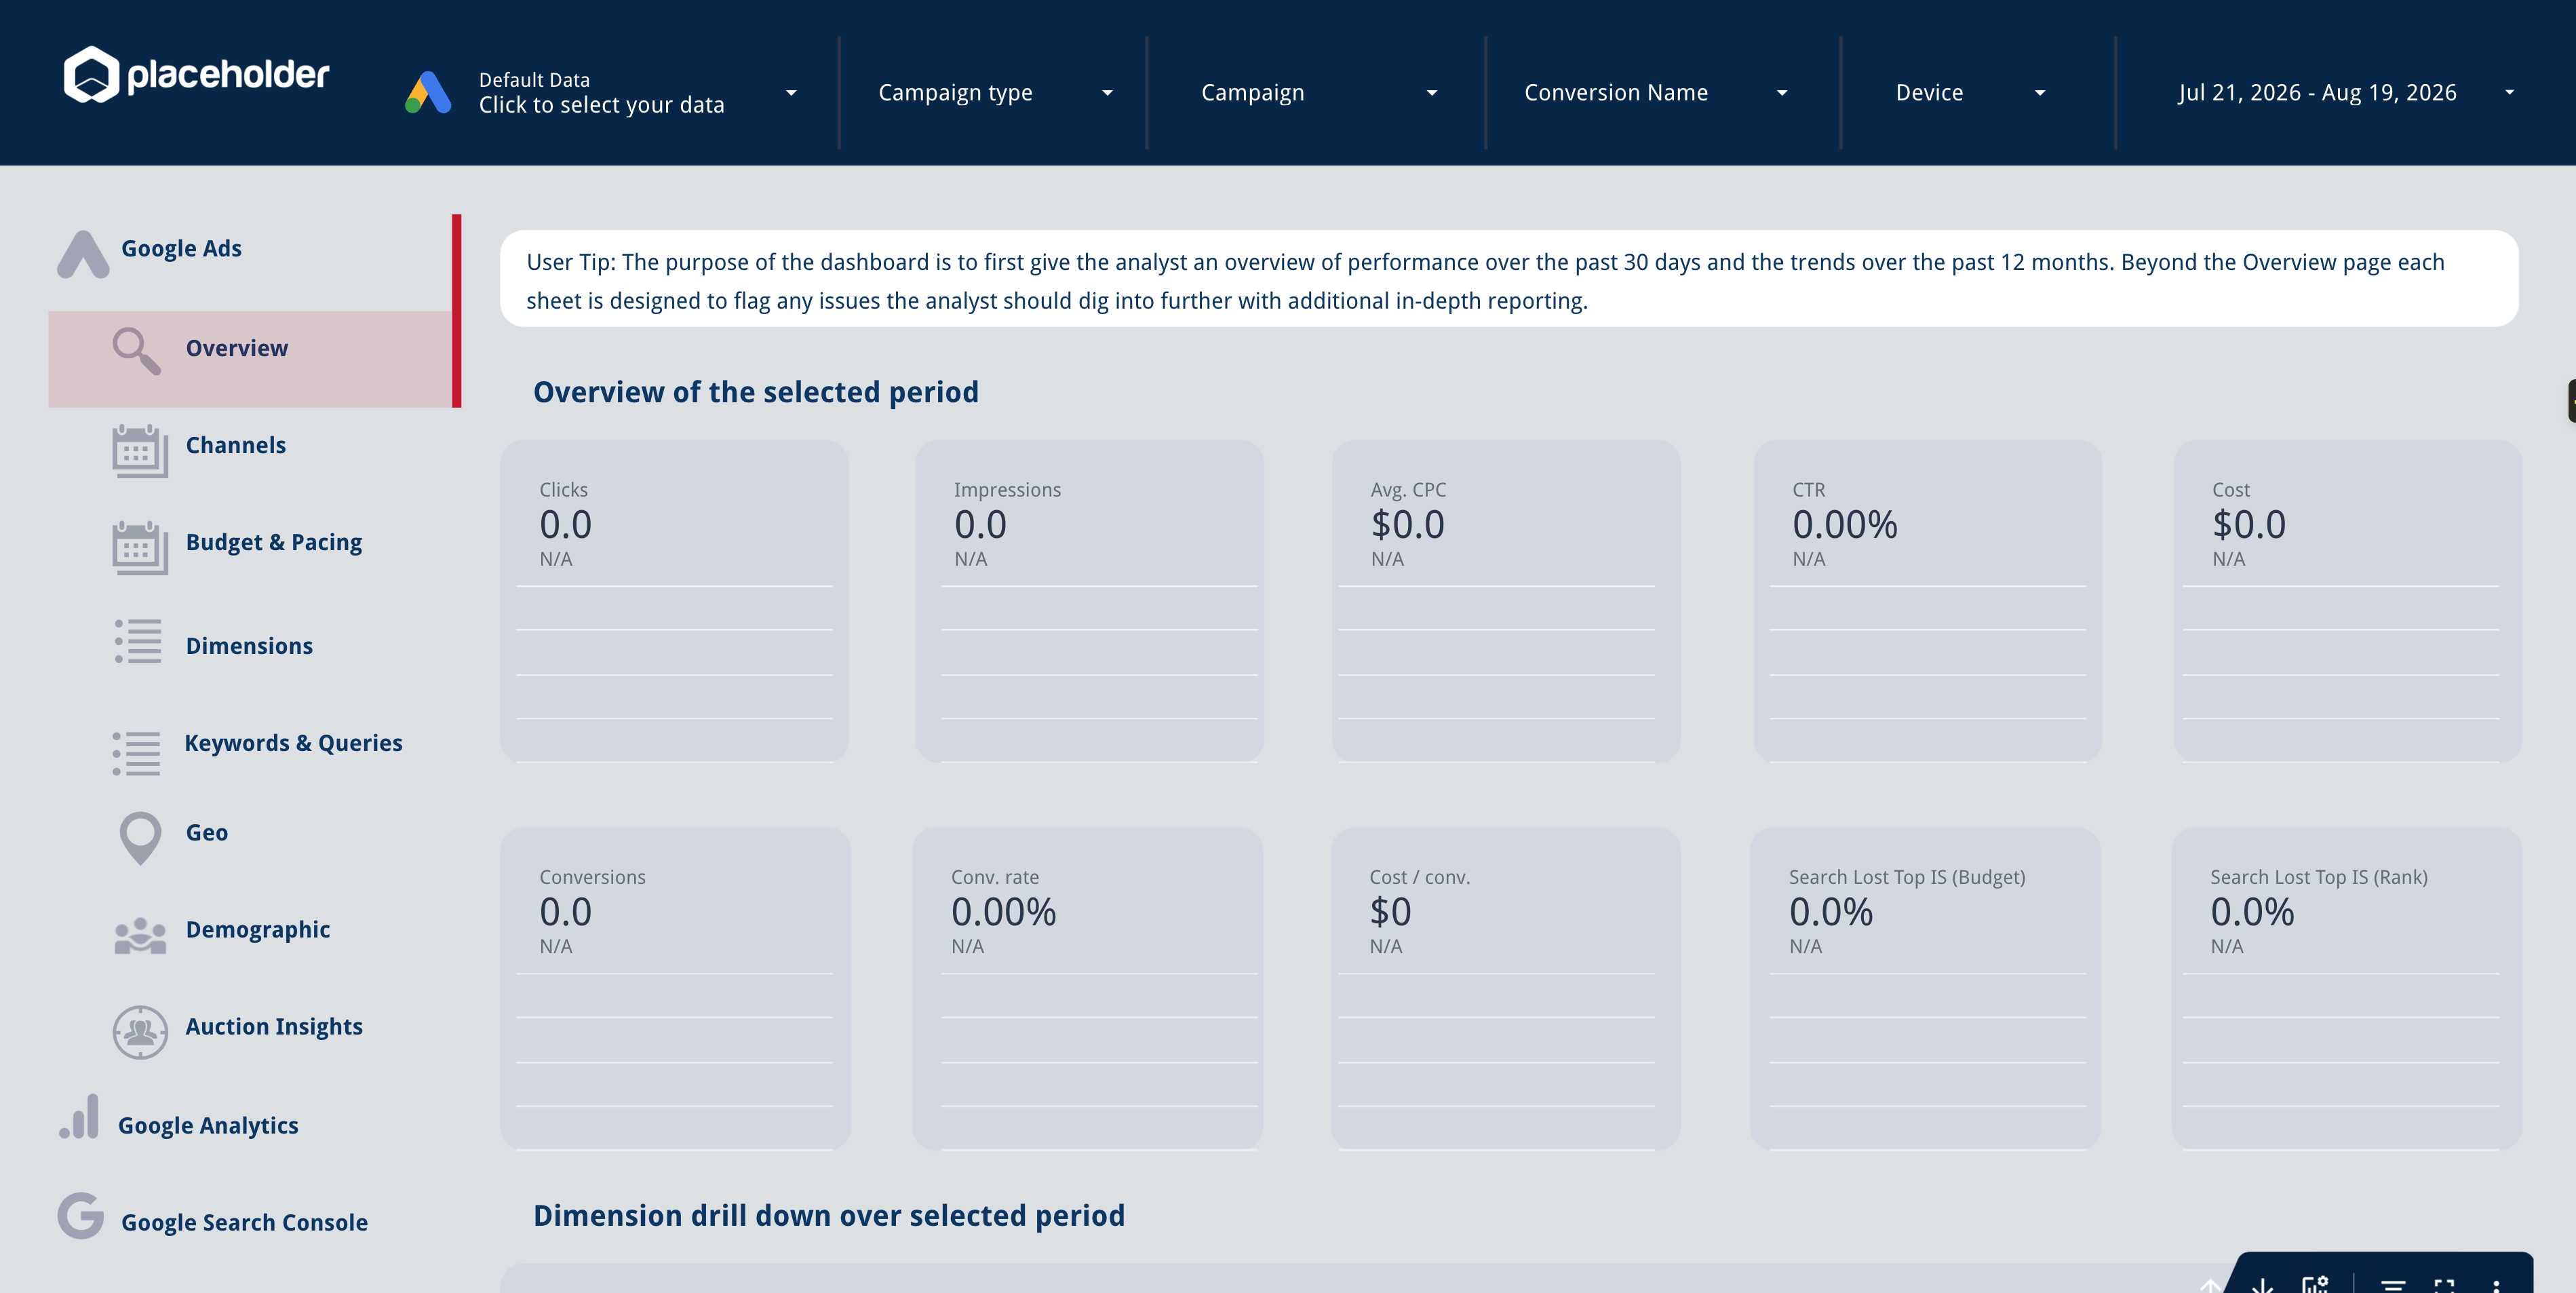
 +
+1 ready-to-use template for Google Ads
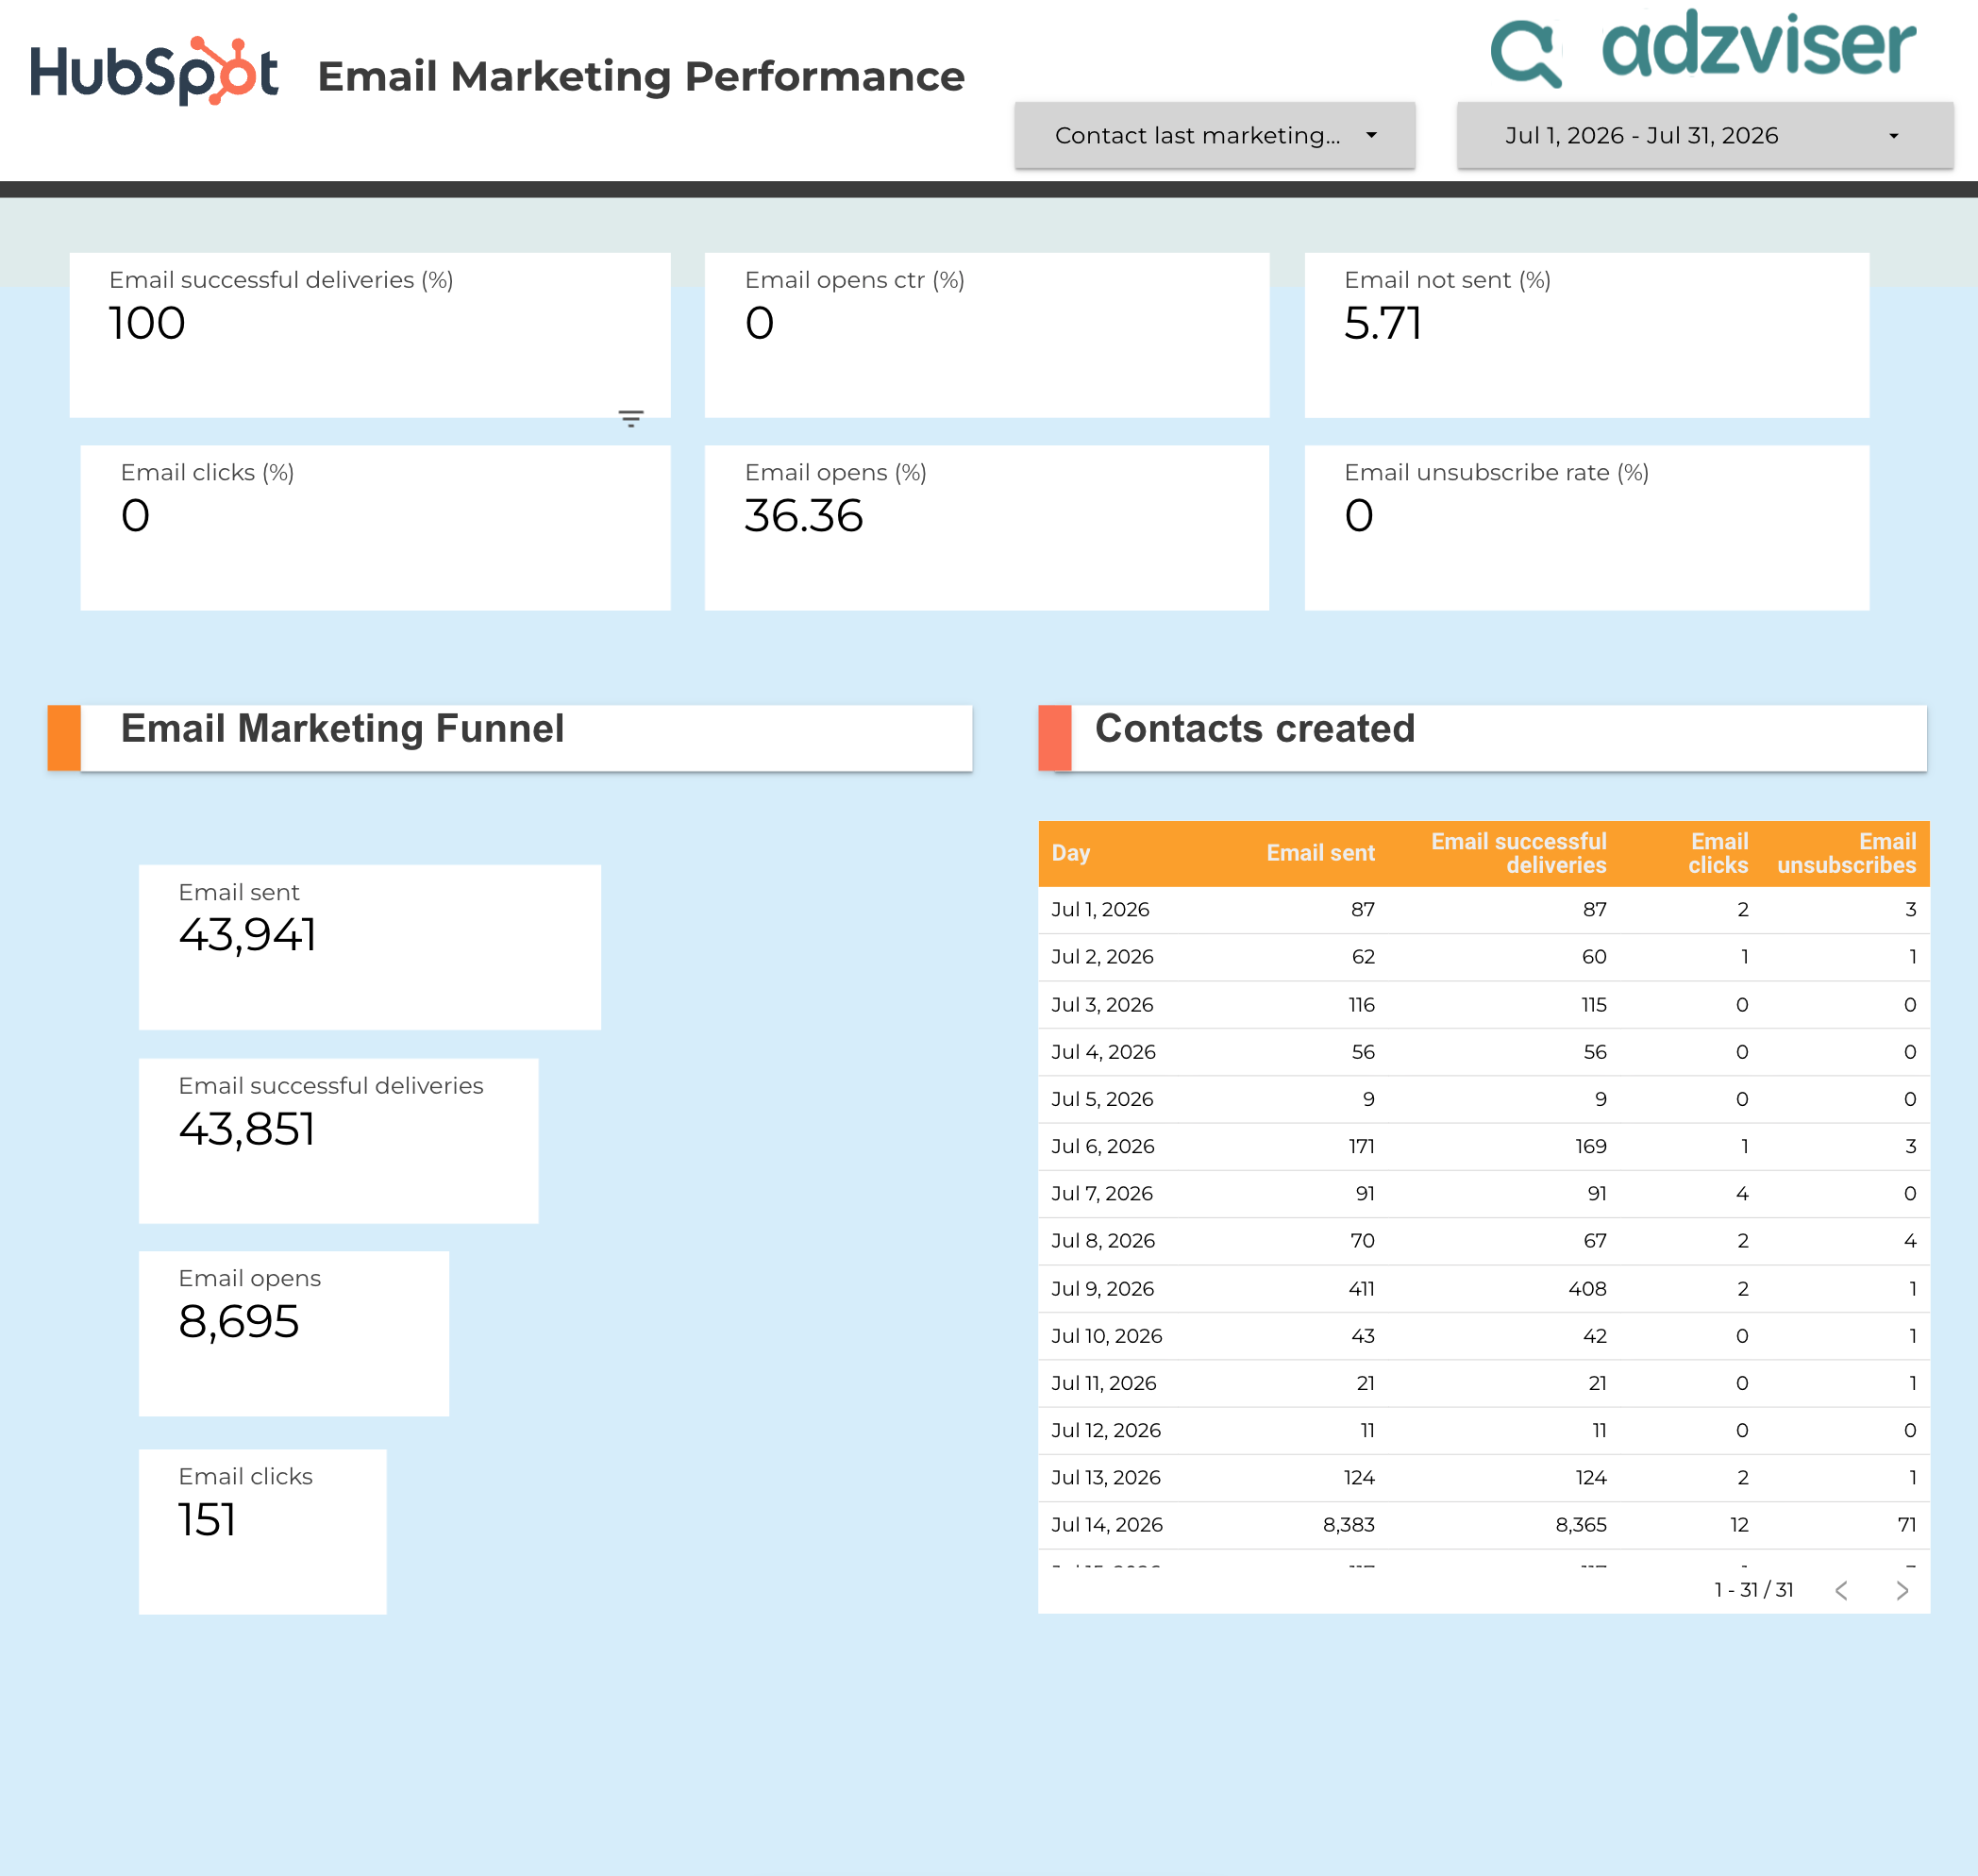
 +
+1 ready-to-use template for HubSpot
 +
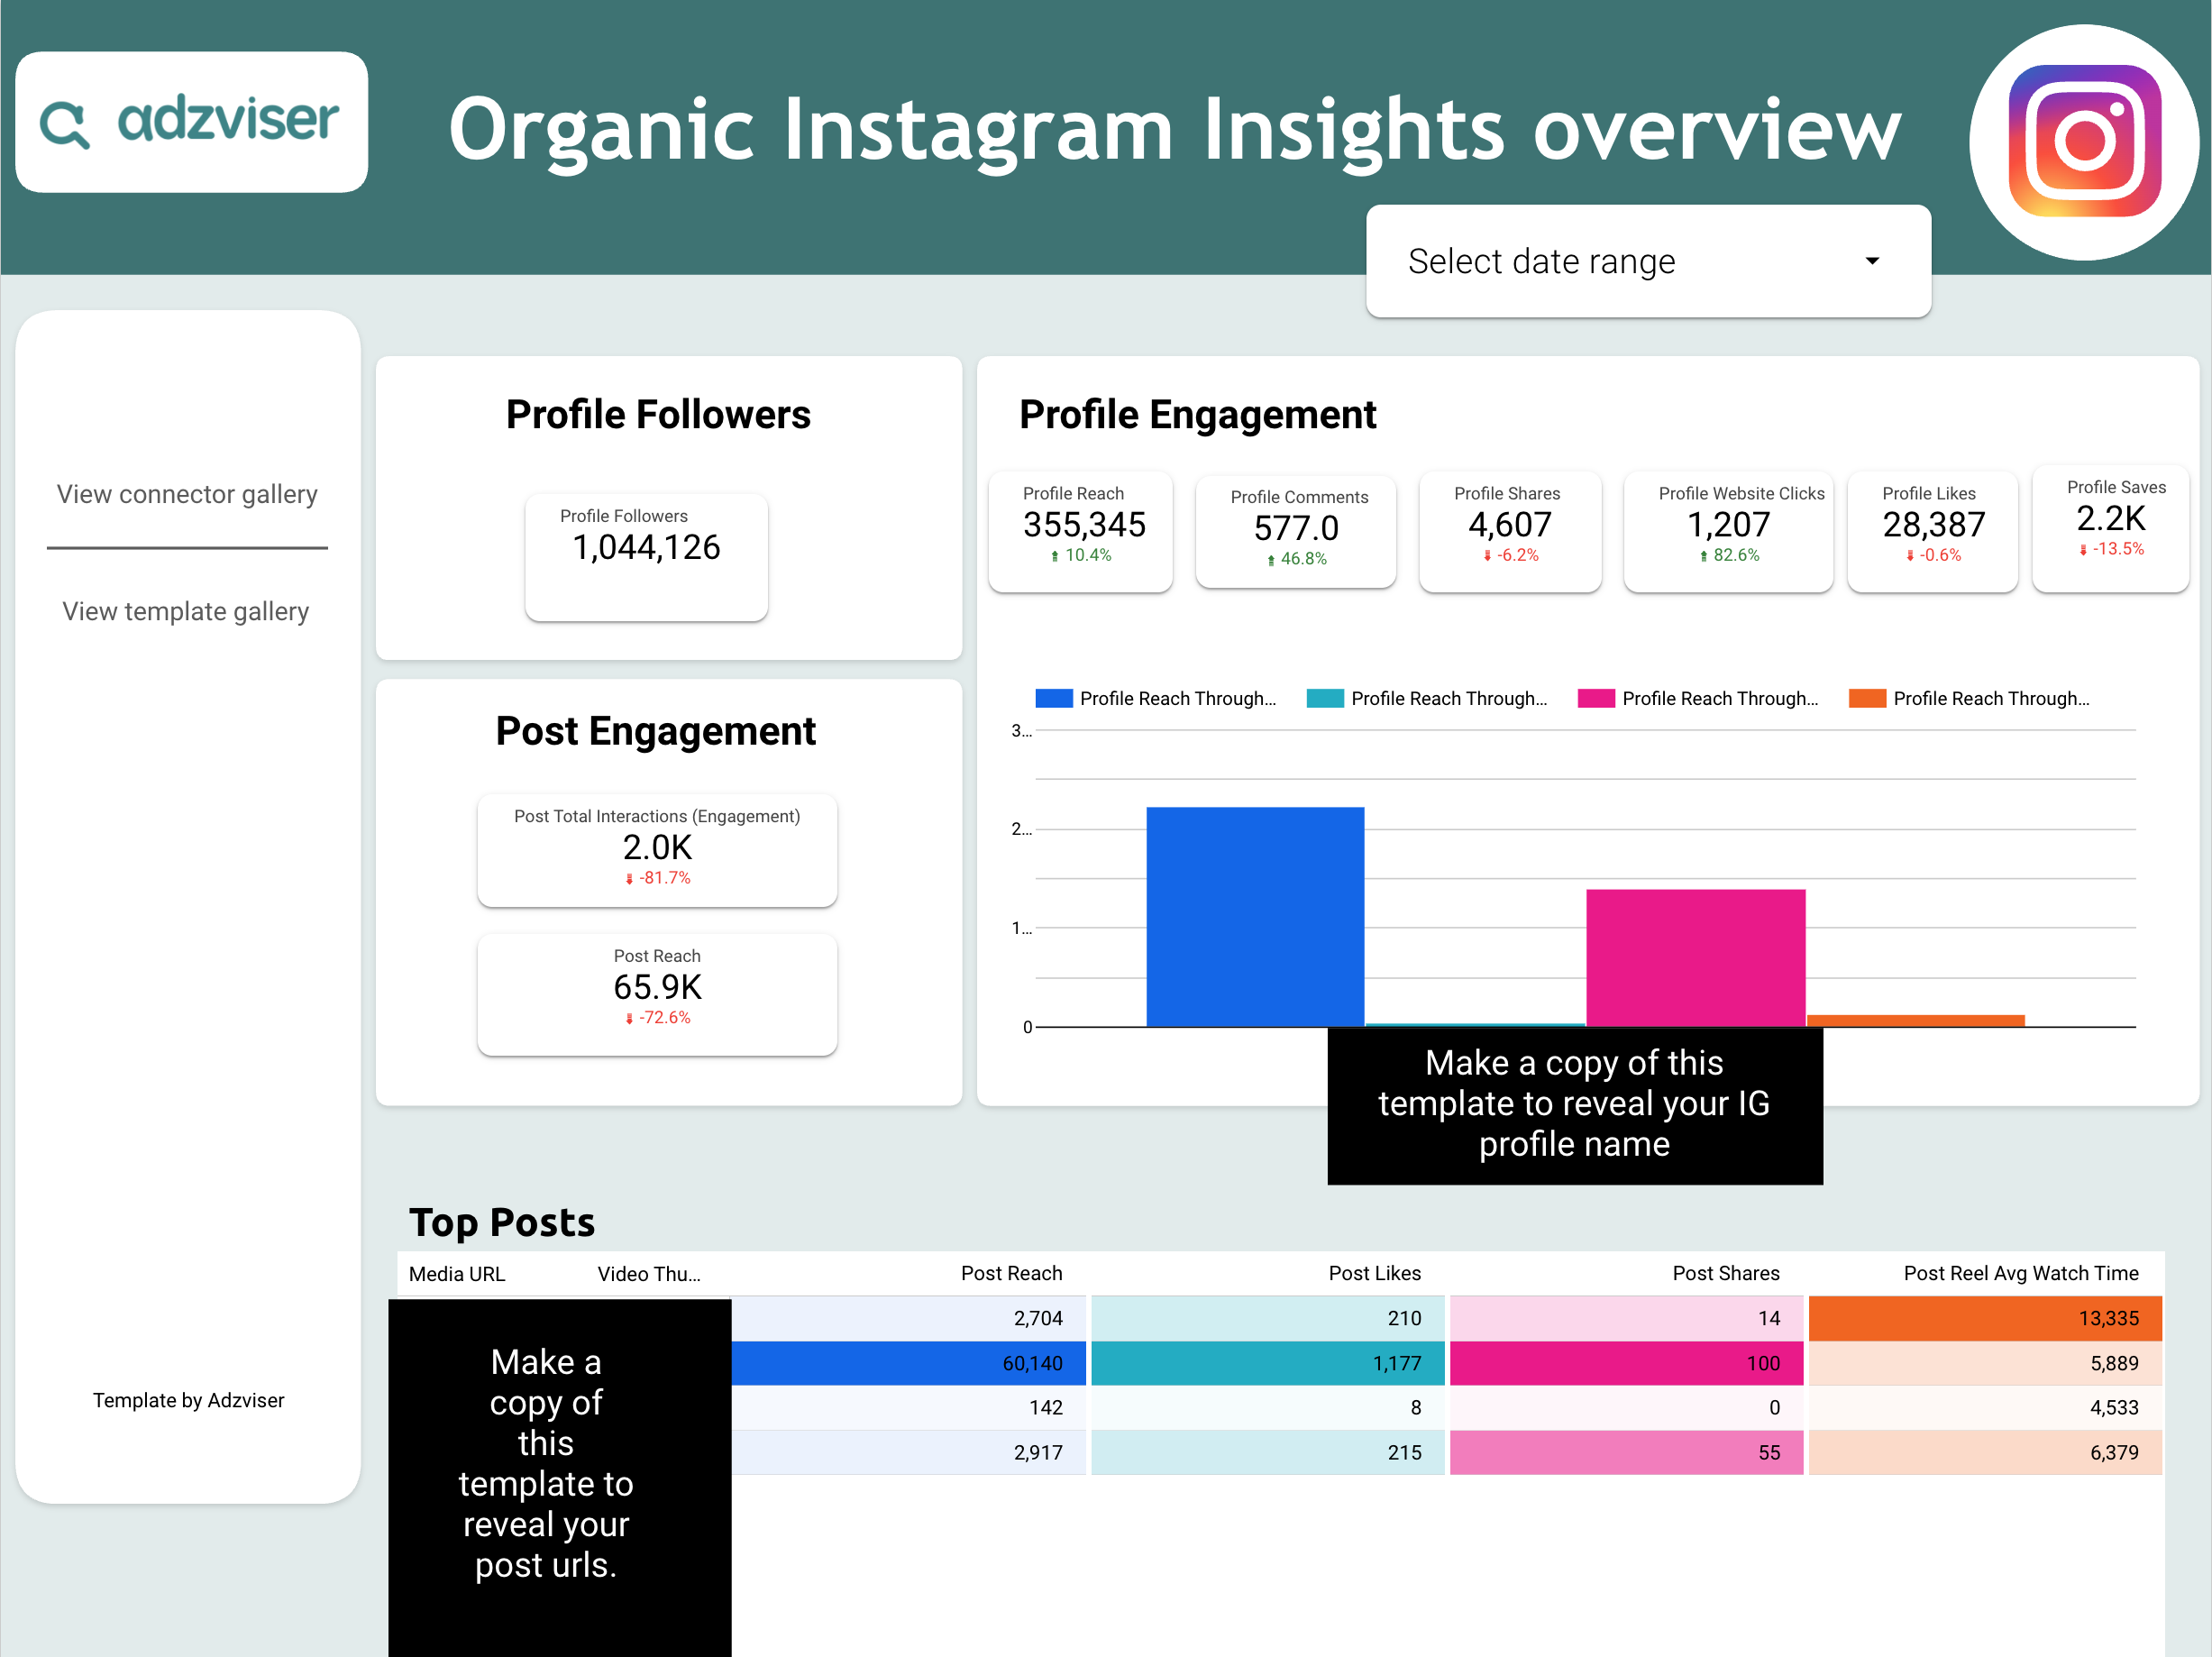
+2 ready-to-use templates for Instagram Insights
 +
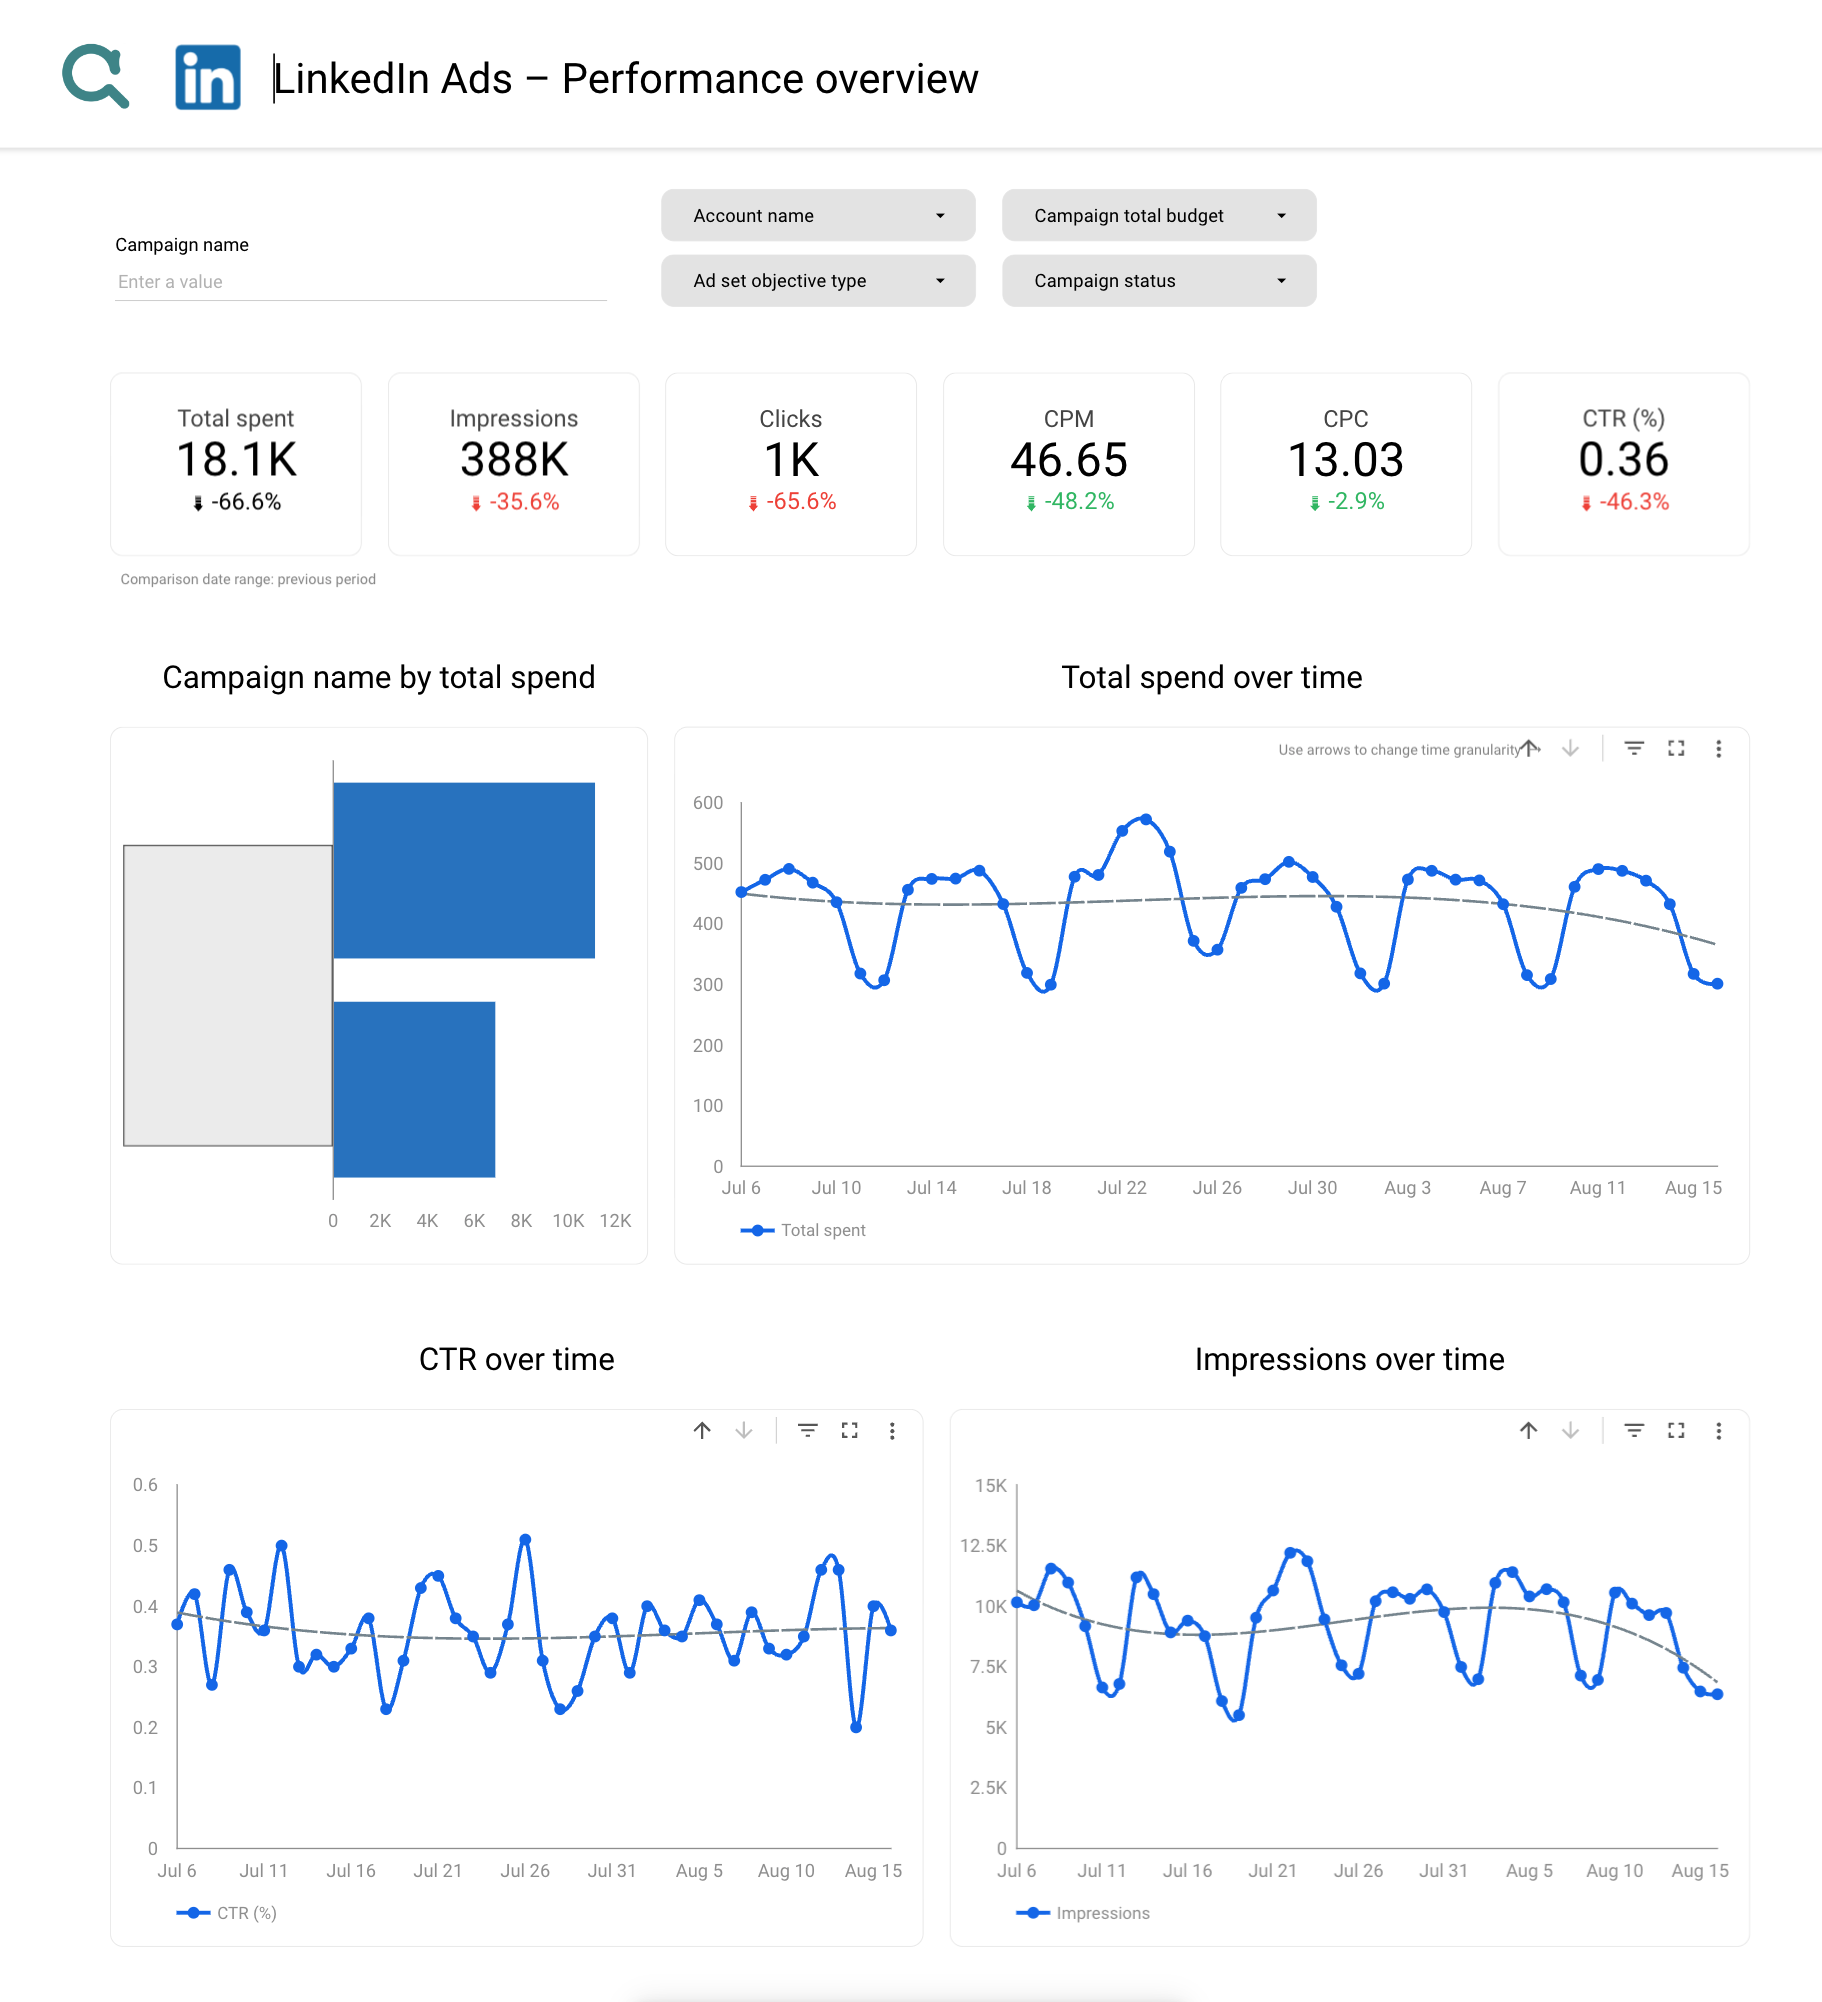
+3 ready-to-use templates for LinkedIn Ads
 +
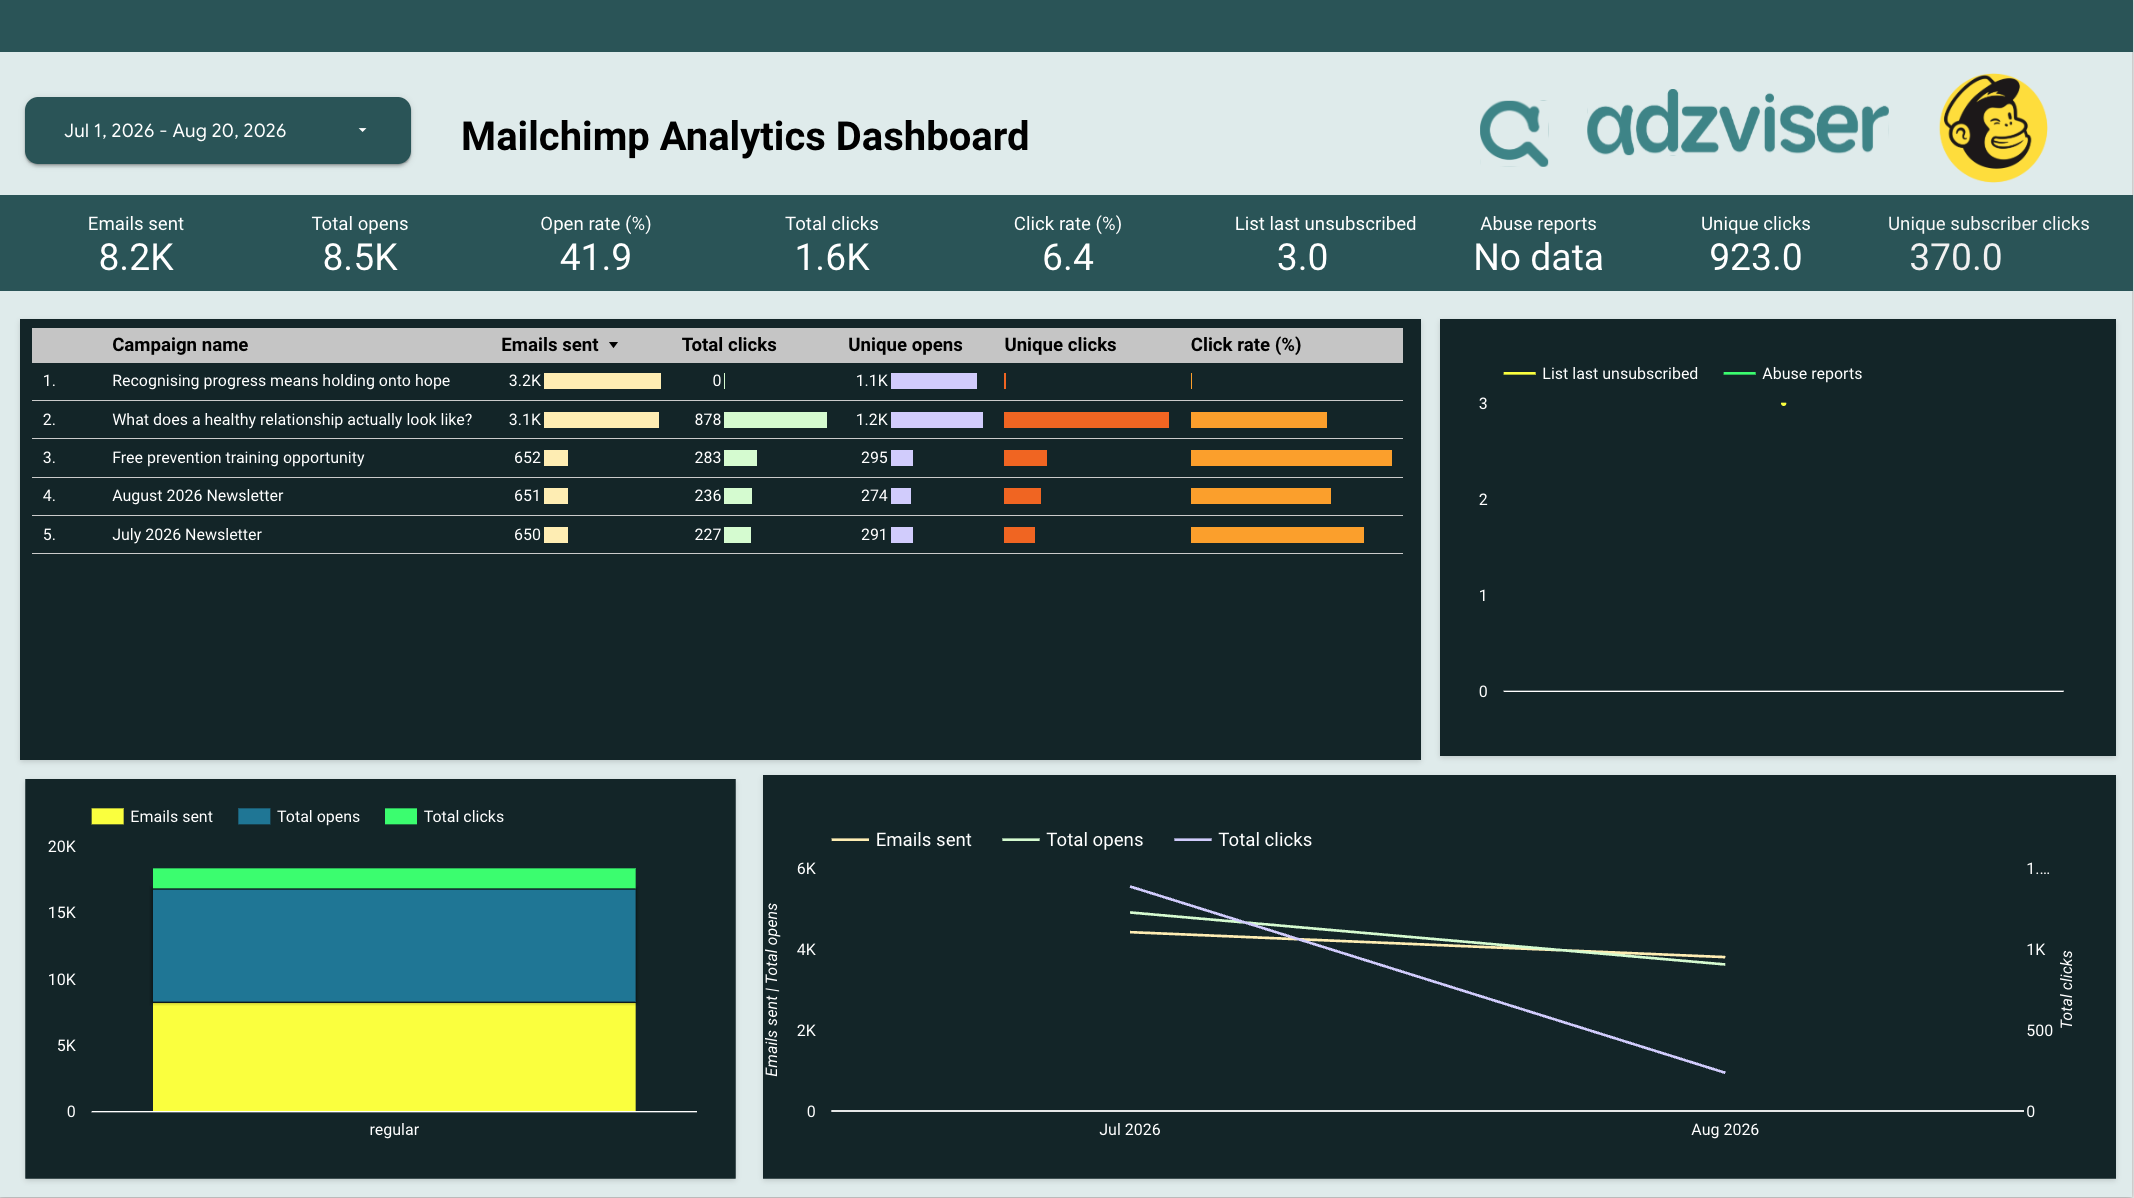
+1 ready-to-use template for Mailchimp
 +
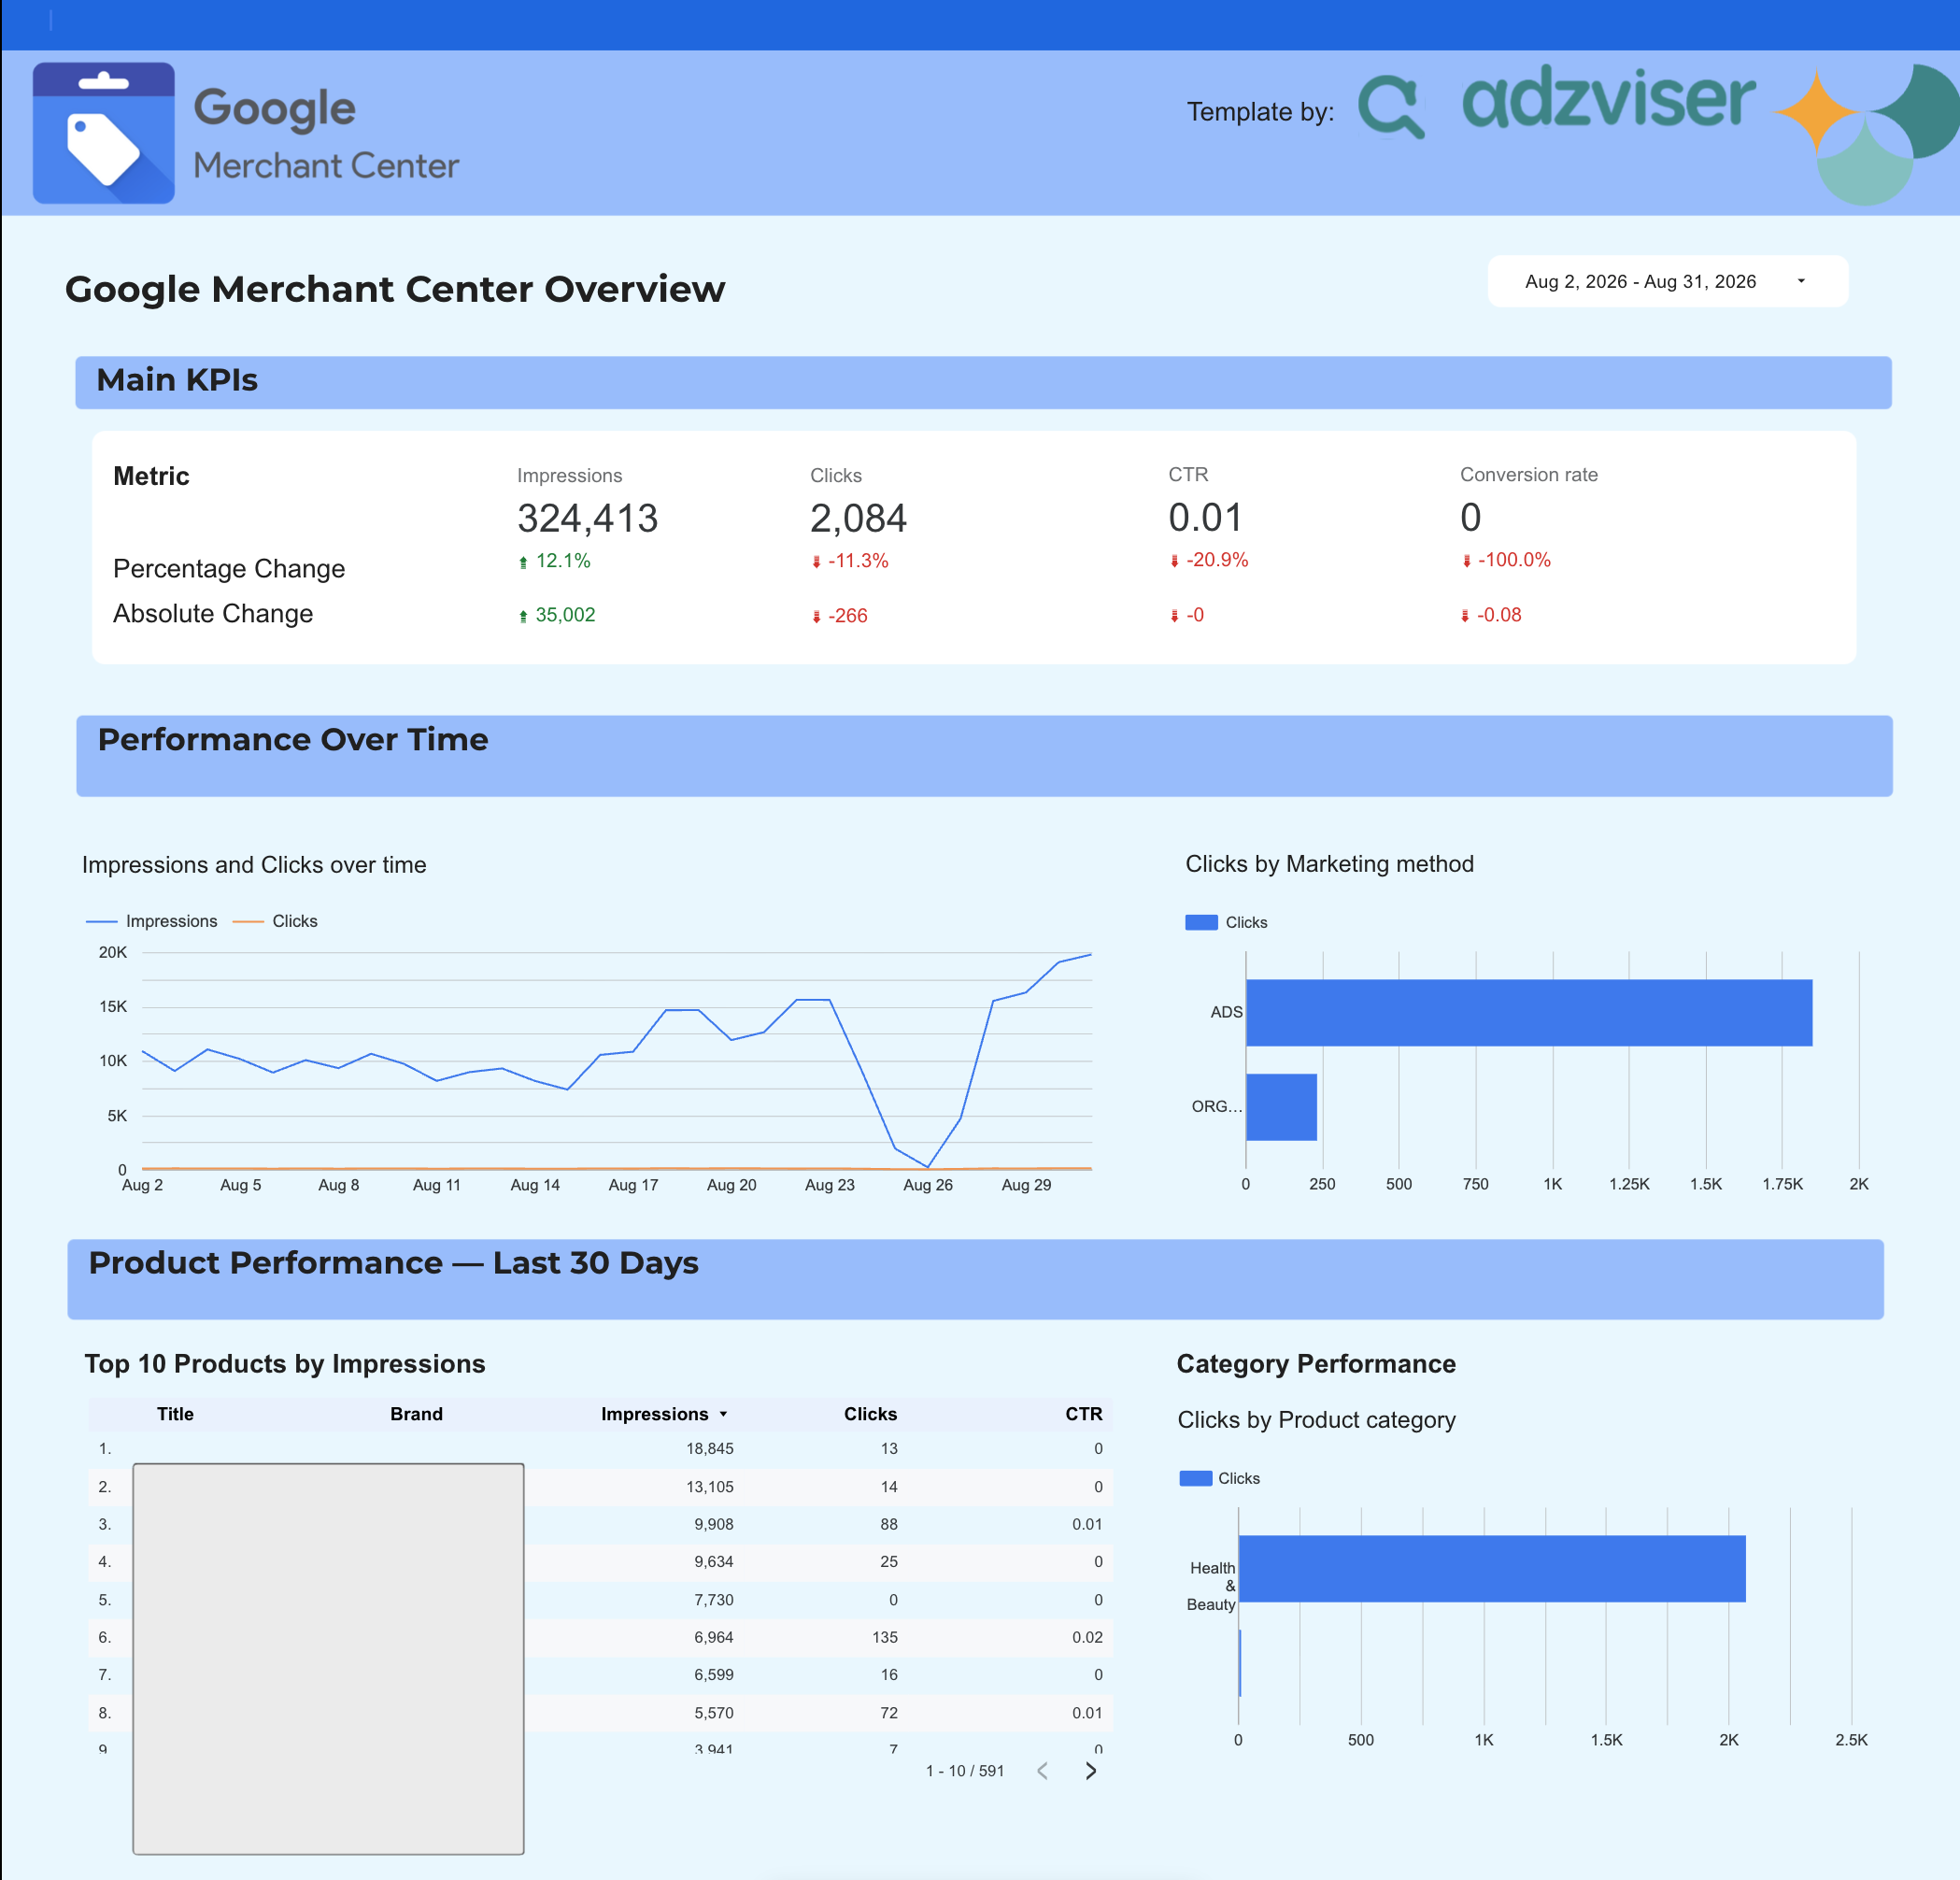
+1 ready-to-use template for Merchant Center
 +
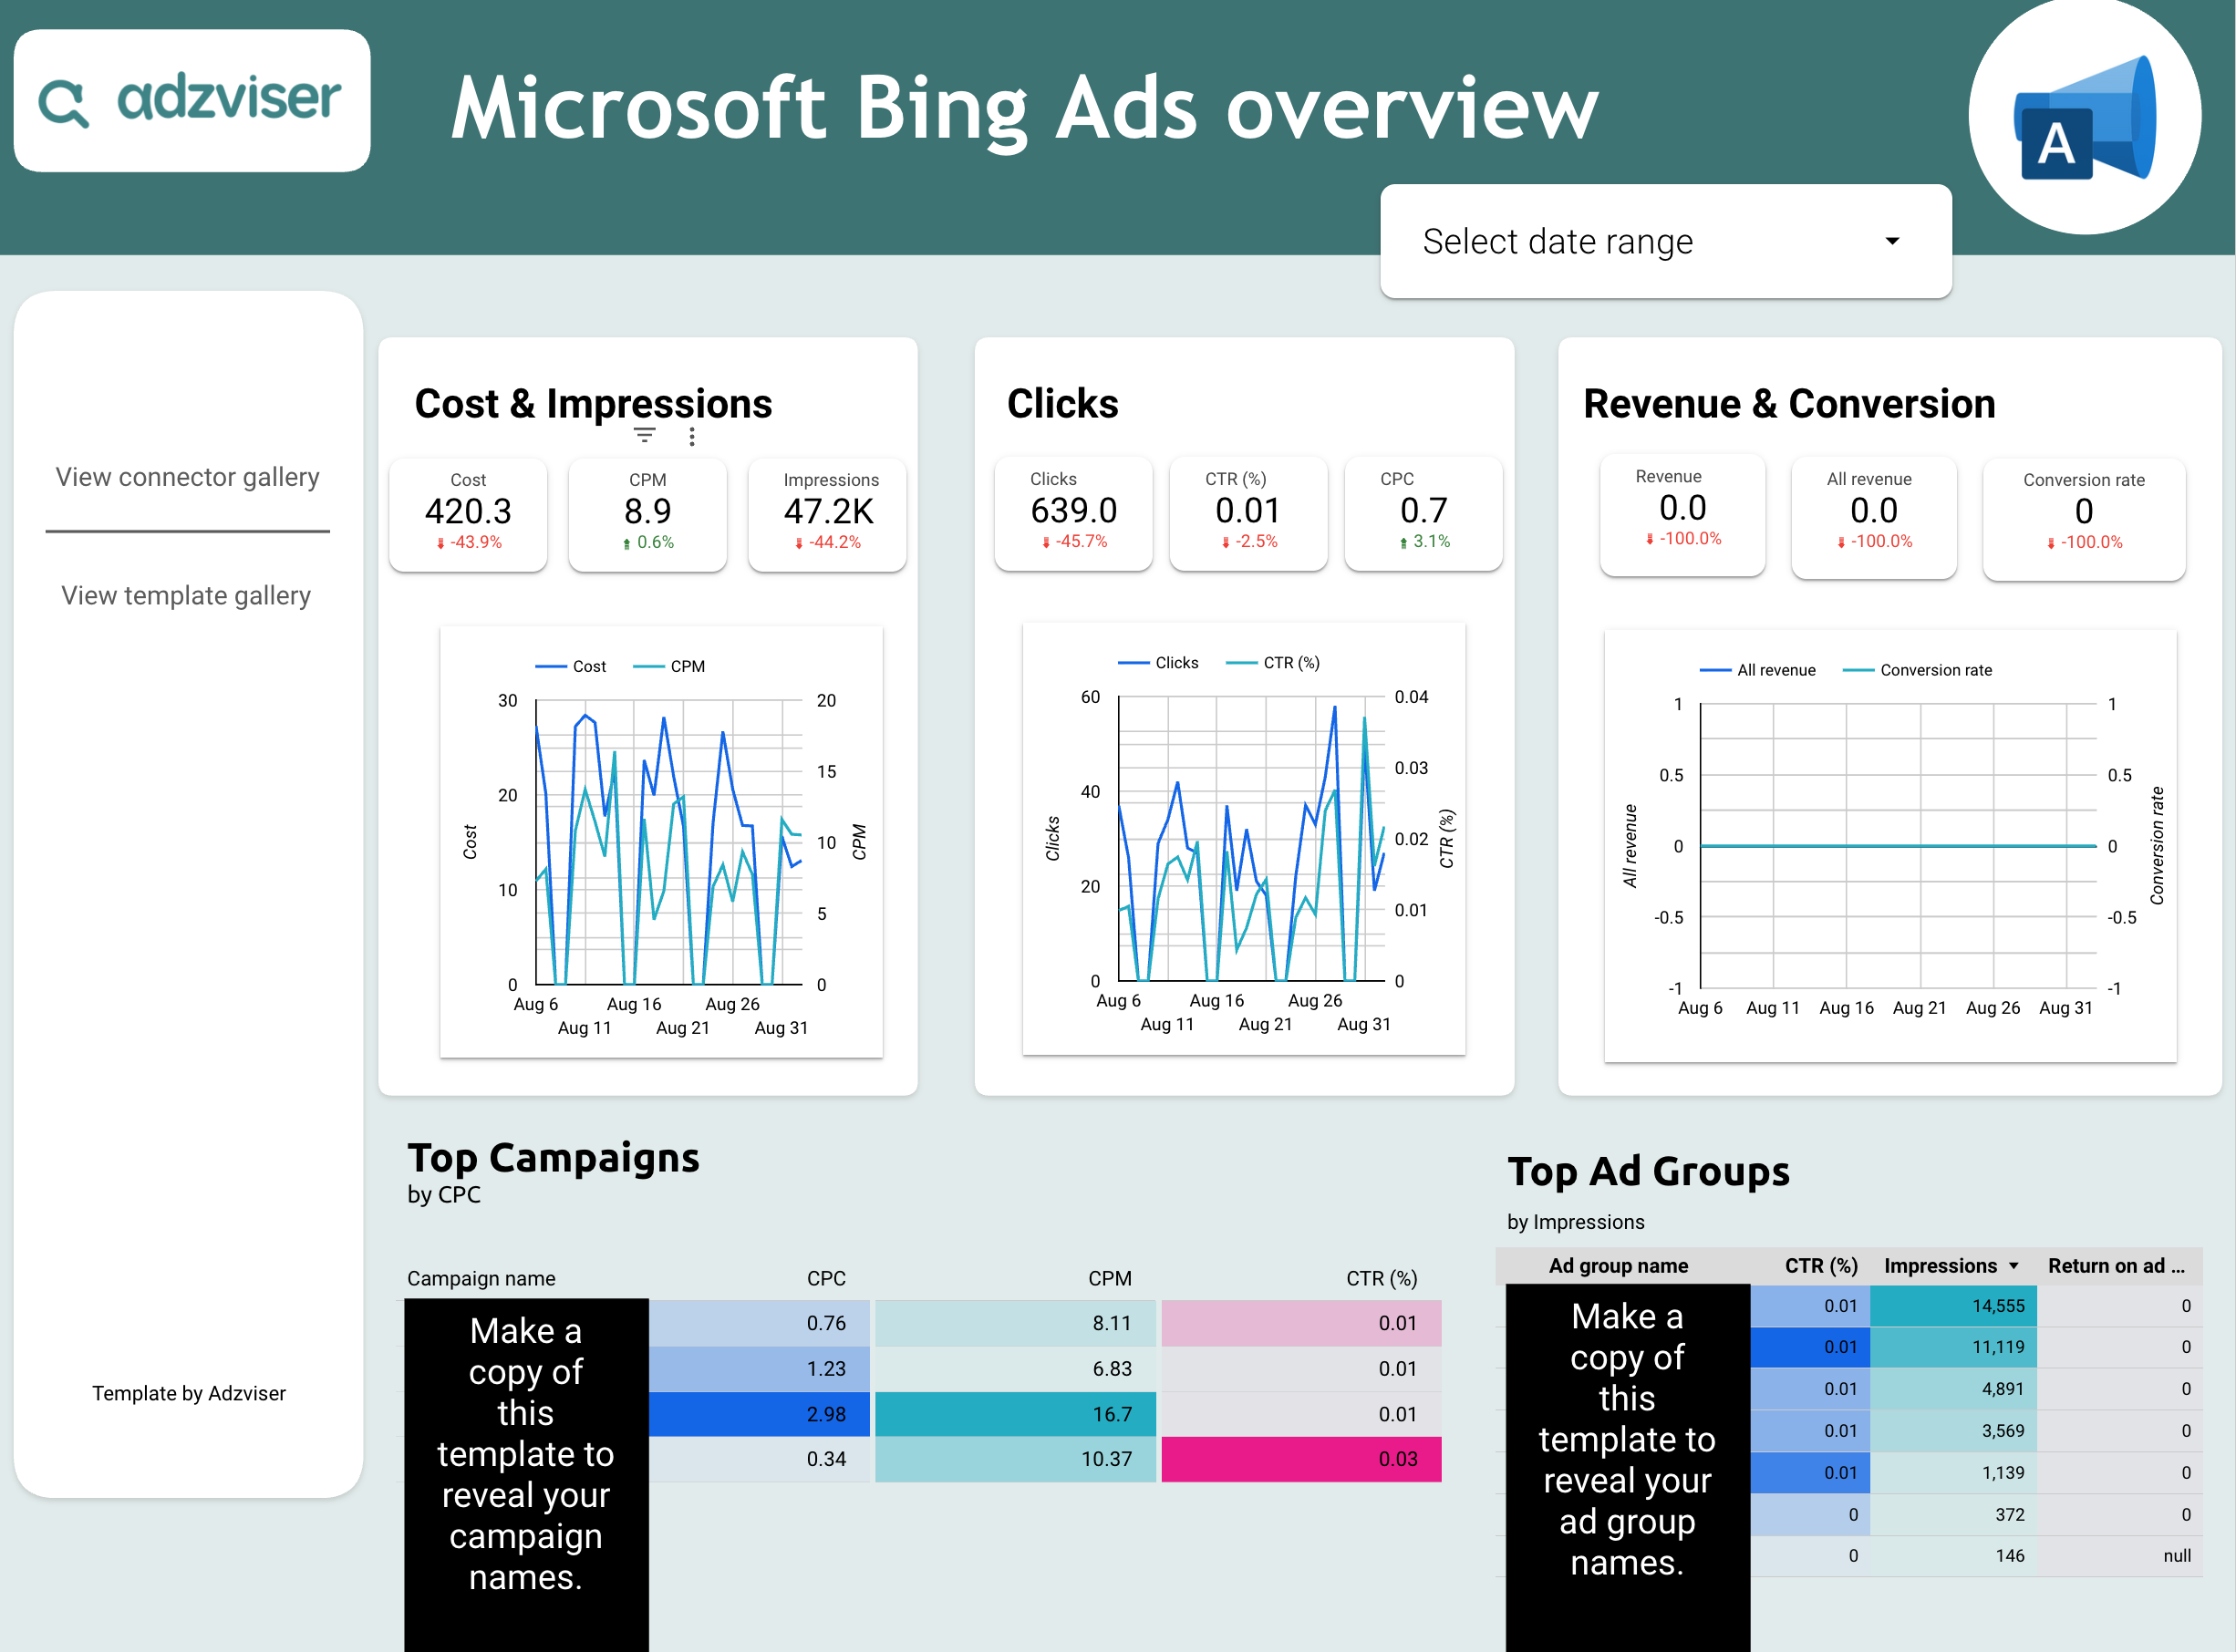
+1 ready-to-use template for Microsoft Ads
 +
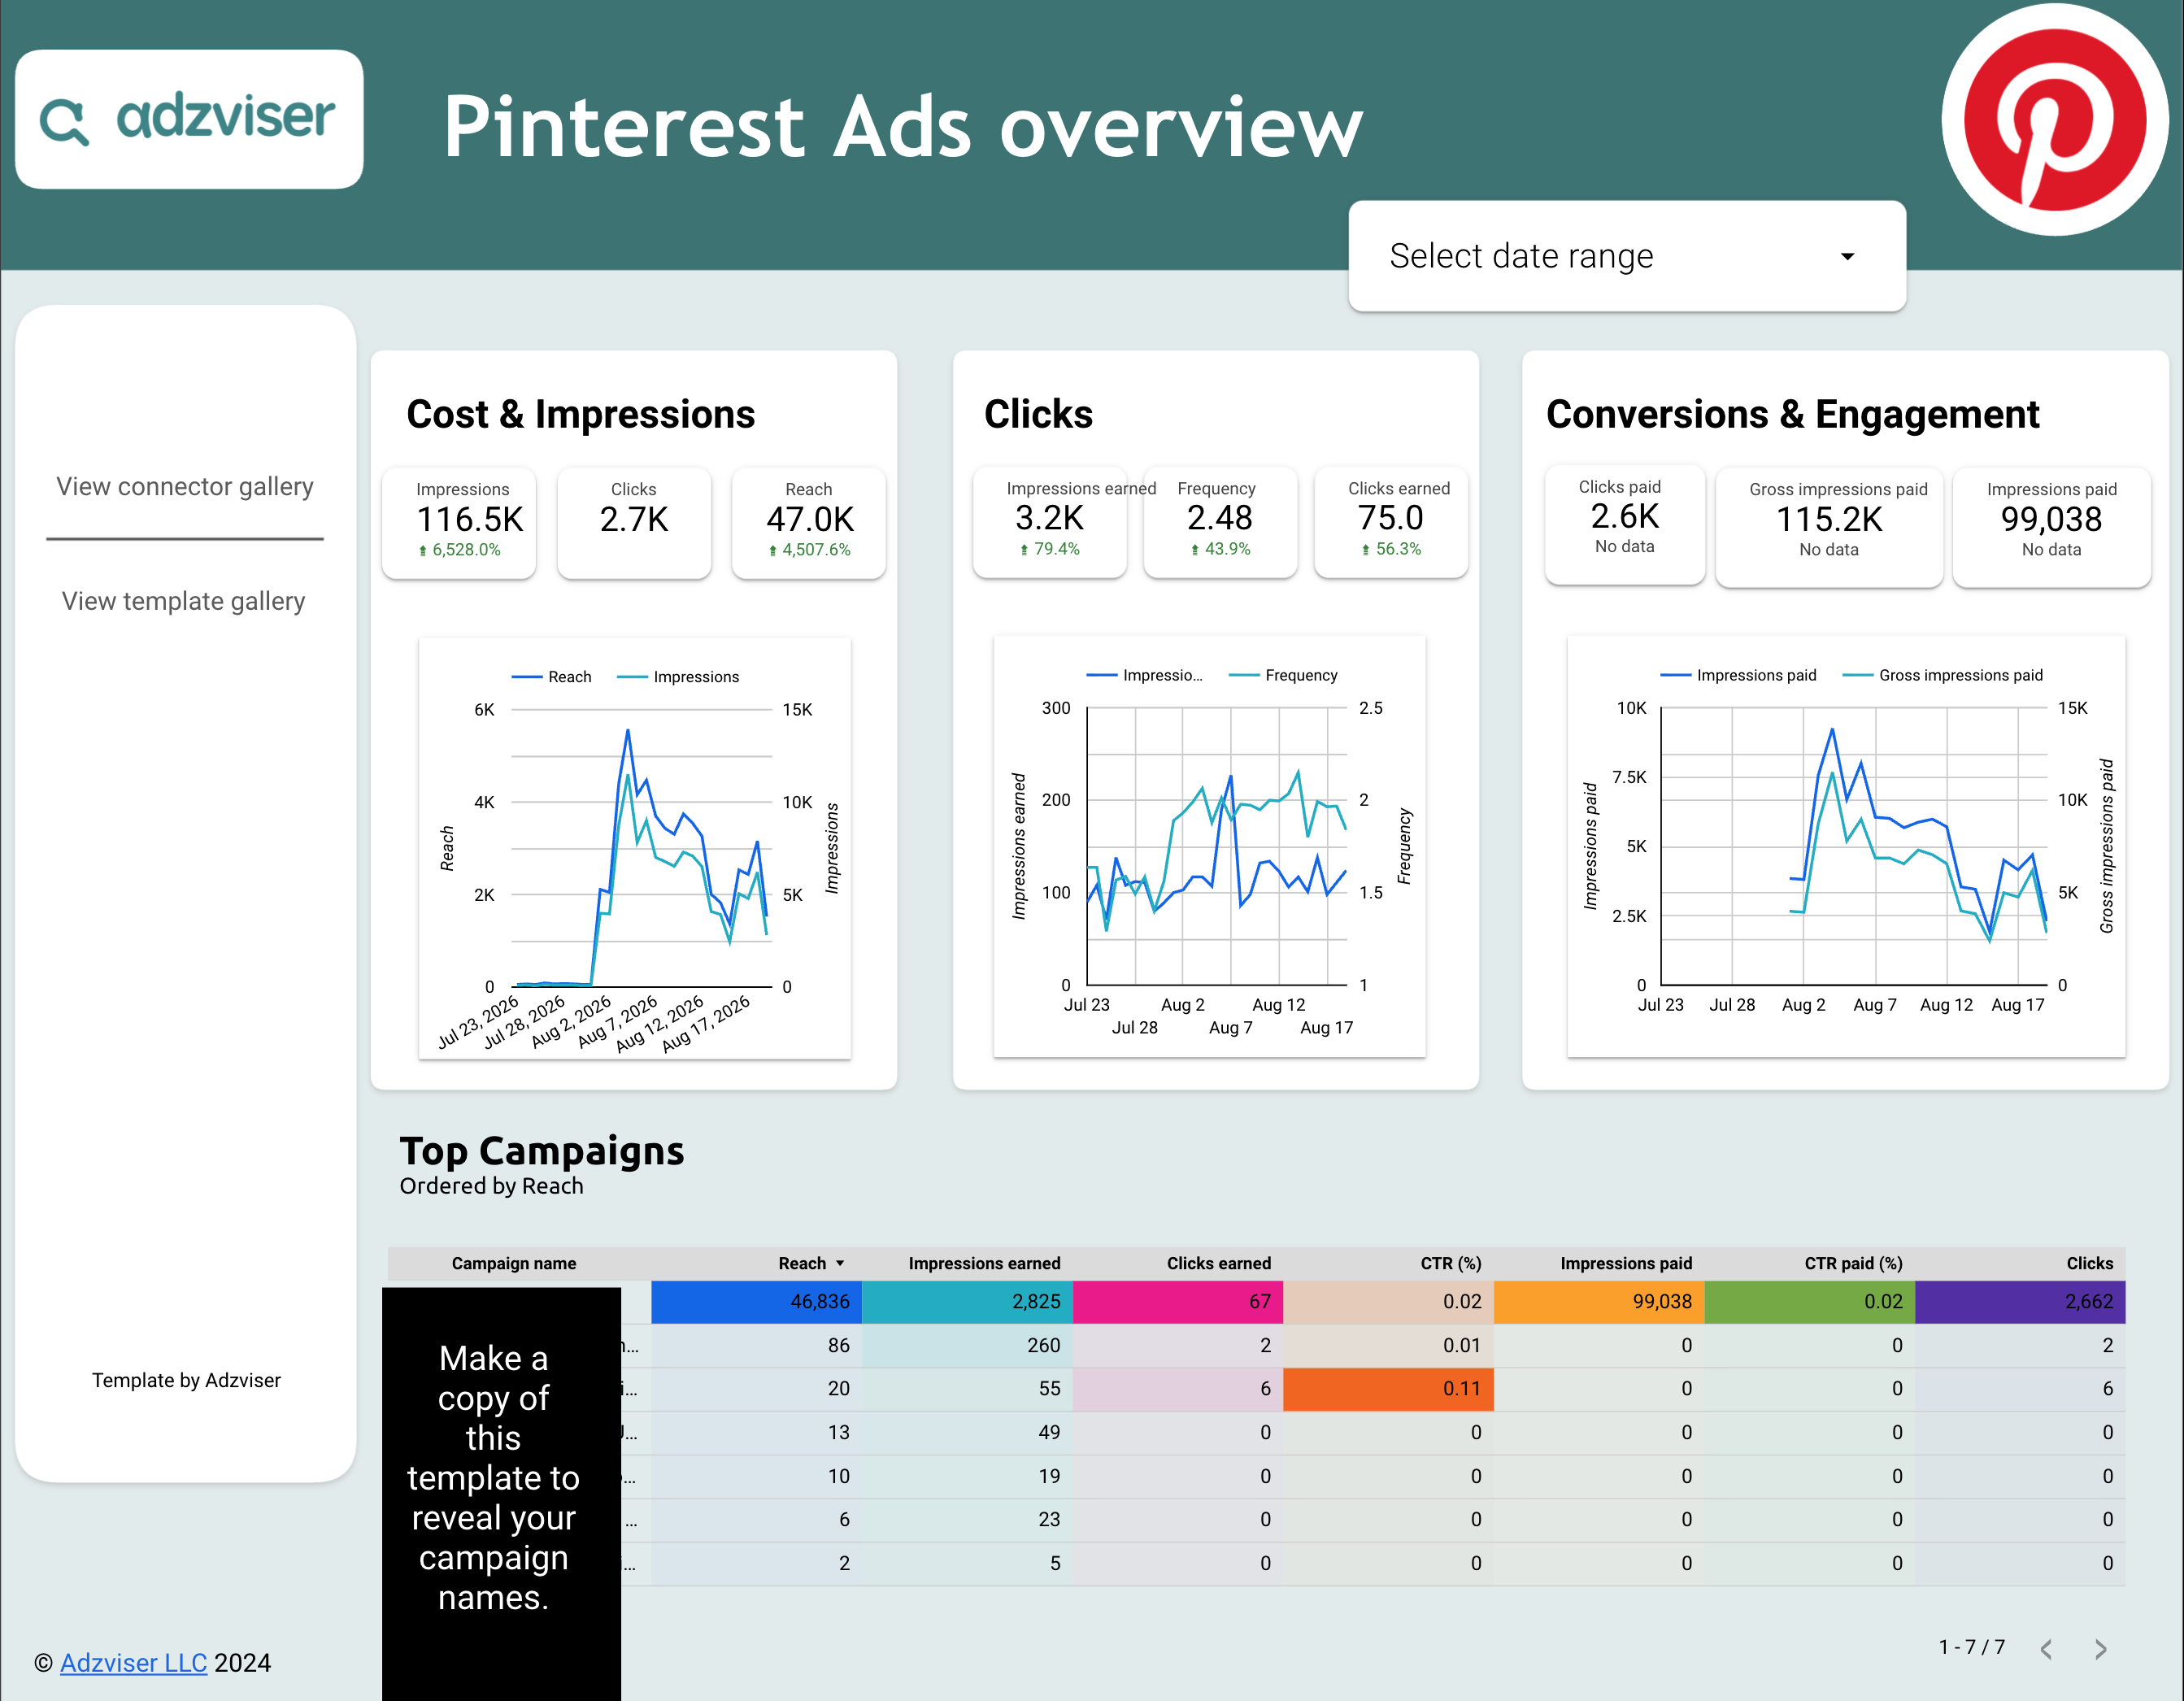
+1 ready-to-use template for Pinterest Ads
 +
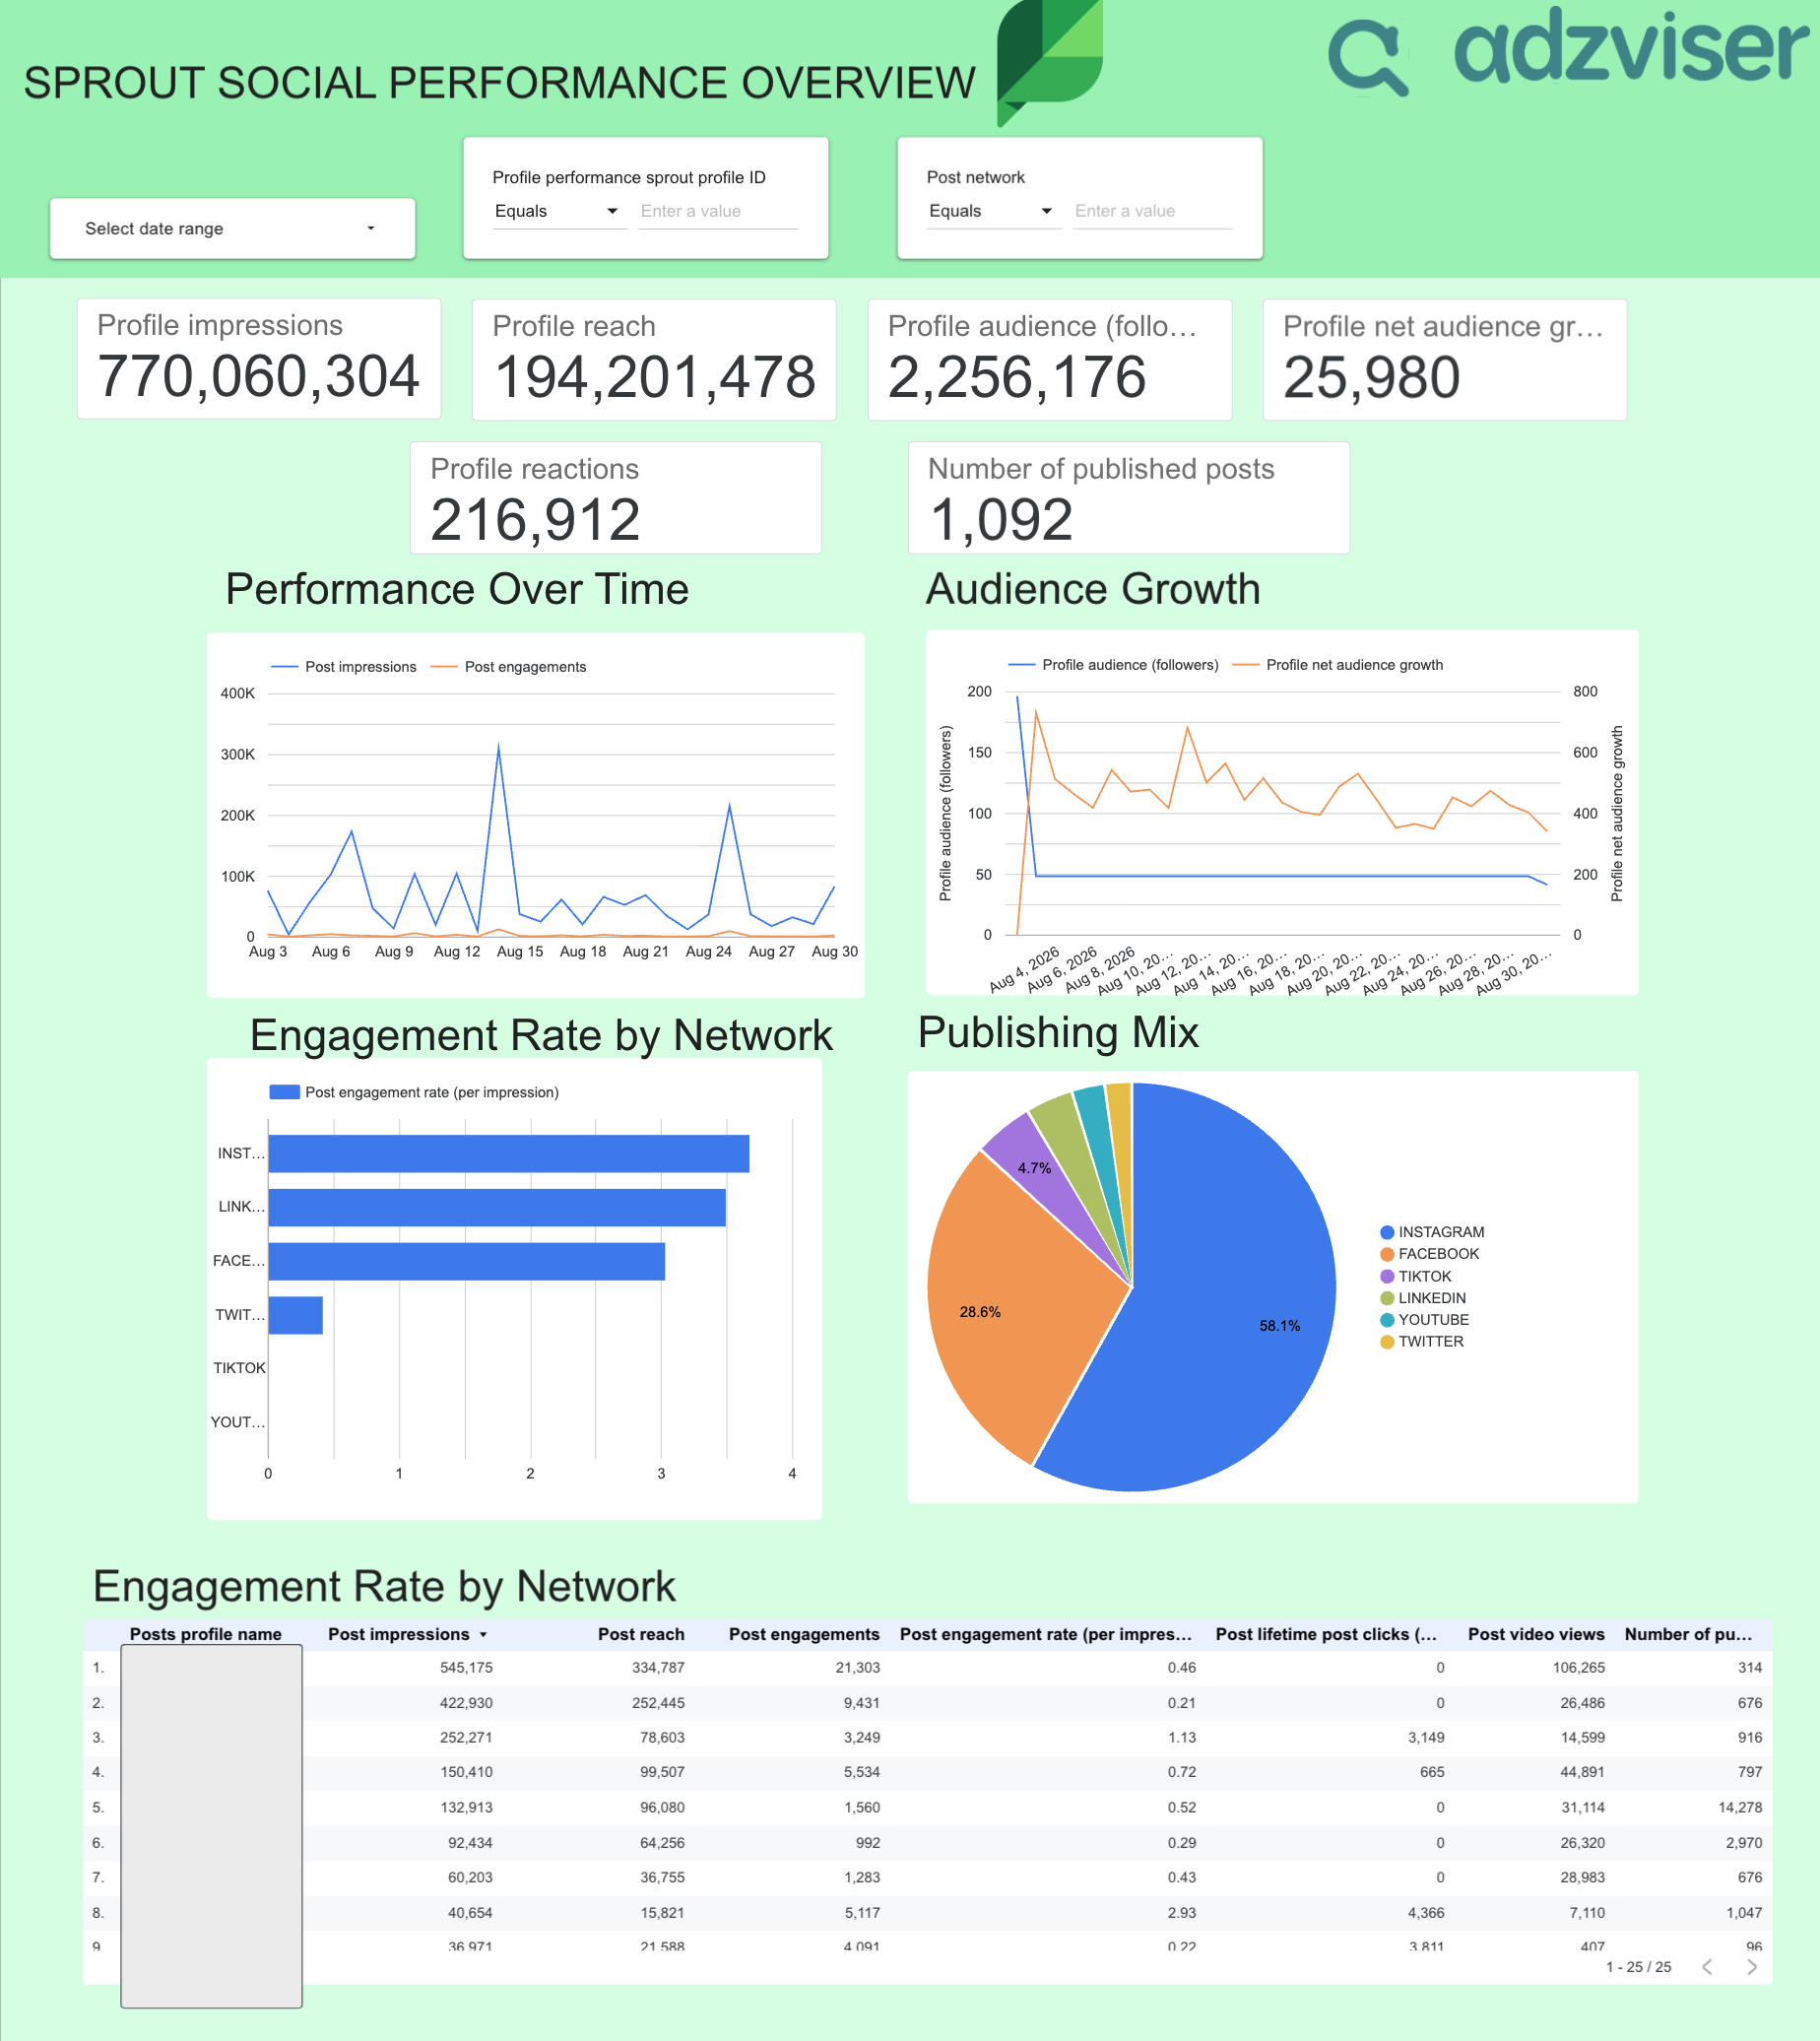
+1 ready-to-use template for Sprout Social
 +
+1 ready-to-use template for TikTok Ads
Choose a template, connect your live data through Adzviser, and customize the result in Data Studio.
Open a template for your data source, review its pages and KPIs, then make an editable copy in your Google account.
Authorize your account with Adzviser and replace the sample connection with the matching live data source.
Change charts, filters, calculated fields, date controls, colors, and branding before sharing the live dashboard with your team or clients.
Use a report structure designed around the source's practical campaign, audience, conversion, sales, or engagement metrics.
Connect through Adzviser so the dashboard can refresh from the source instead of relying on repeated CSV exports and copy-paste work.
Edit the layout and visual system, add calculated fields, and adapt the dashboard for internal analysis or white-label client reporting.
See how marketers use Adzviser to connect live marketing data to Data Studio and build client-ready dashboards.
Open the template, make a copy in your Google account, and replace its sample data source with the matching Adzviser connector. Authorize the marketing account you want to report on, then confirm that each chart is using the new data source.
Making a copy does not automatically replace the template's sample connection. Edit the copied report, open Manage added data sources, and replace the sample source with the Adzviser connector and account you authorized. Check any chart that still references the old source.
Data Studio requests data through the connected Adzviser source and may cache results according to the data source's freshness setting. You can also refresh the report manually when you need to request the latest available data.
Yes. Connect the required accounts inside Adzviser, then configure the report's data source and account selection for the view you need. Agencies often keep a separate dashboard copy per client so permissions, filters, and branding remain independent.
Yes. Add each supported Adzviser source to the report, then use separate charts or Data Studio blending where a chart needs fields from more than one source. The available joins and calculations depend on the dimensions shared by those sources.
Yes. Your copy is editable, so you can replace logos, colors, fonts, labels, pages, charts, and controls. You can then use Data Studio's normal sharing options to grant view or edit access to teammates and clients.
Yes. Google renamed Looker Studio back to Data Studio in April 2026. Reports created under the Looker Studio name continue to work; you may still see both names in older links, documentation, or template copy.