Free Instagram Insights Data Studio Dashboard Templates
Choose a ready-to-use Instagram Insights dashboard template, connect live data with Adzviser, and start tracking performance in Data Studio.
Choose an Instagram Insights Data Studio Dashboard Template
Start with the view that matches your reporting goal. Each template is designed for live Instagram Insights data and can be customized in Data Studio.
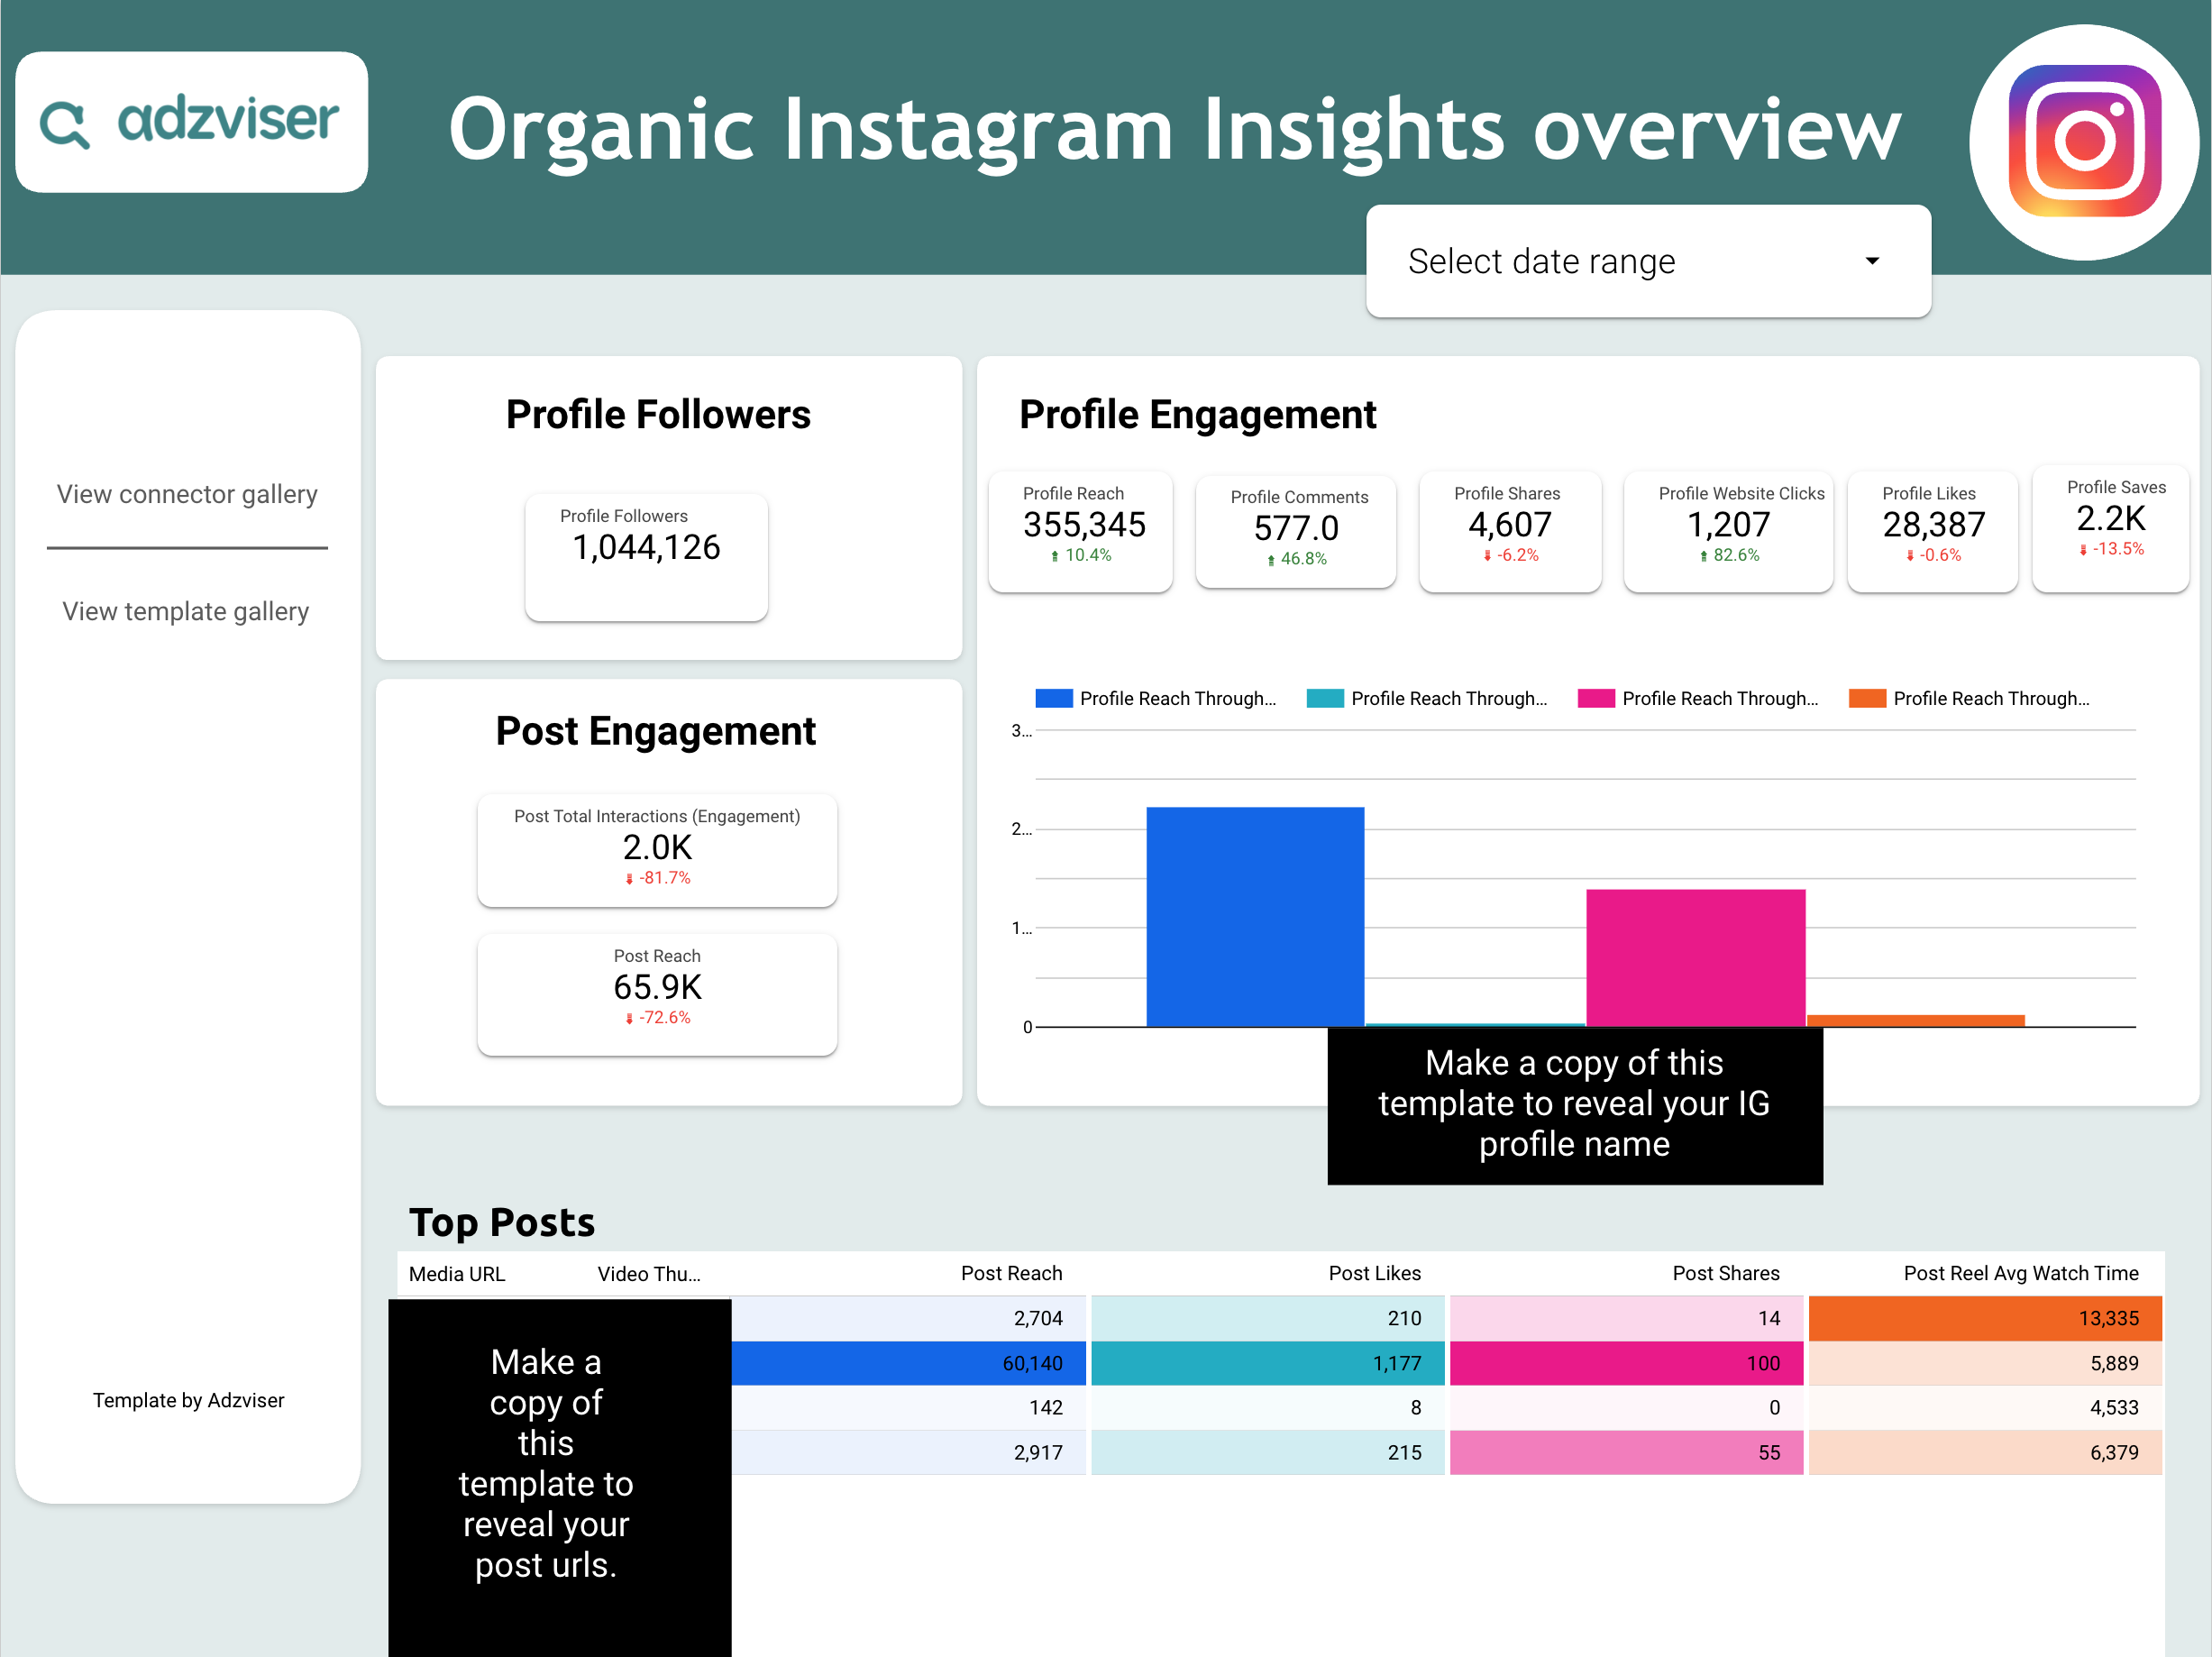
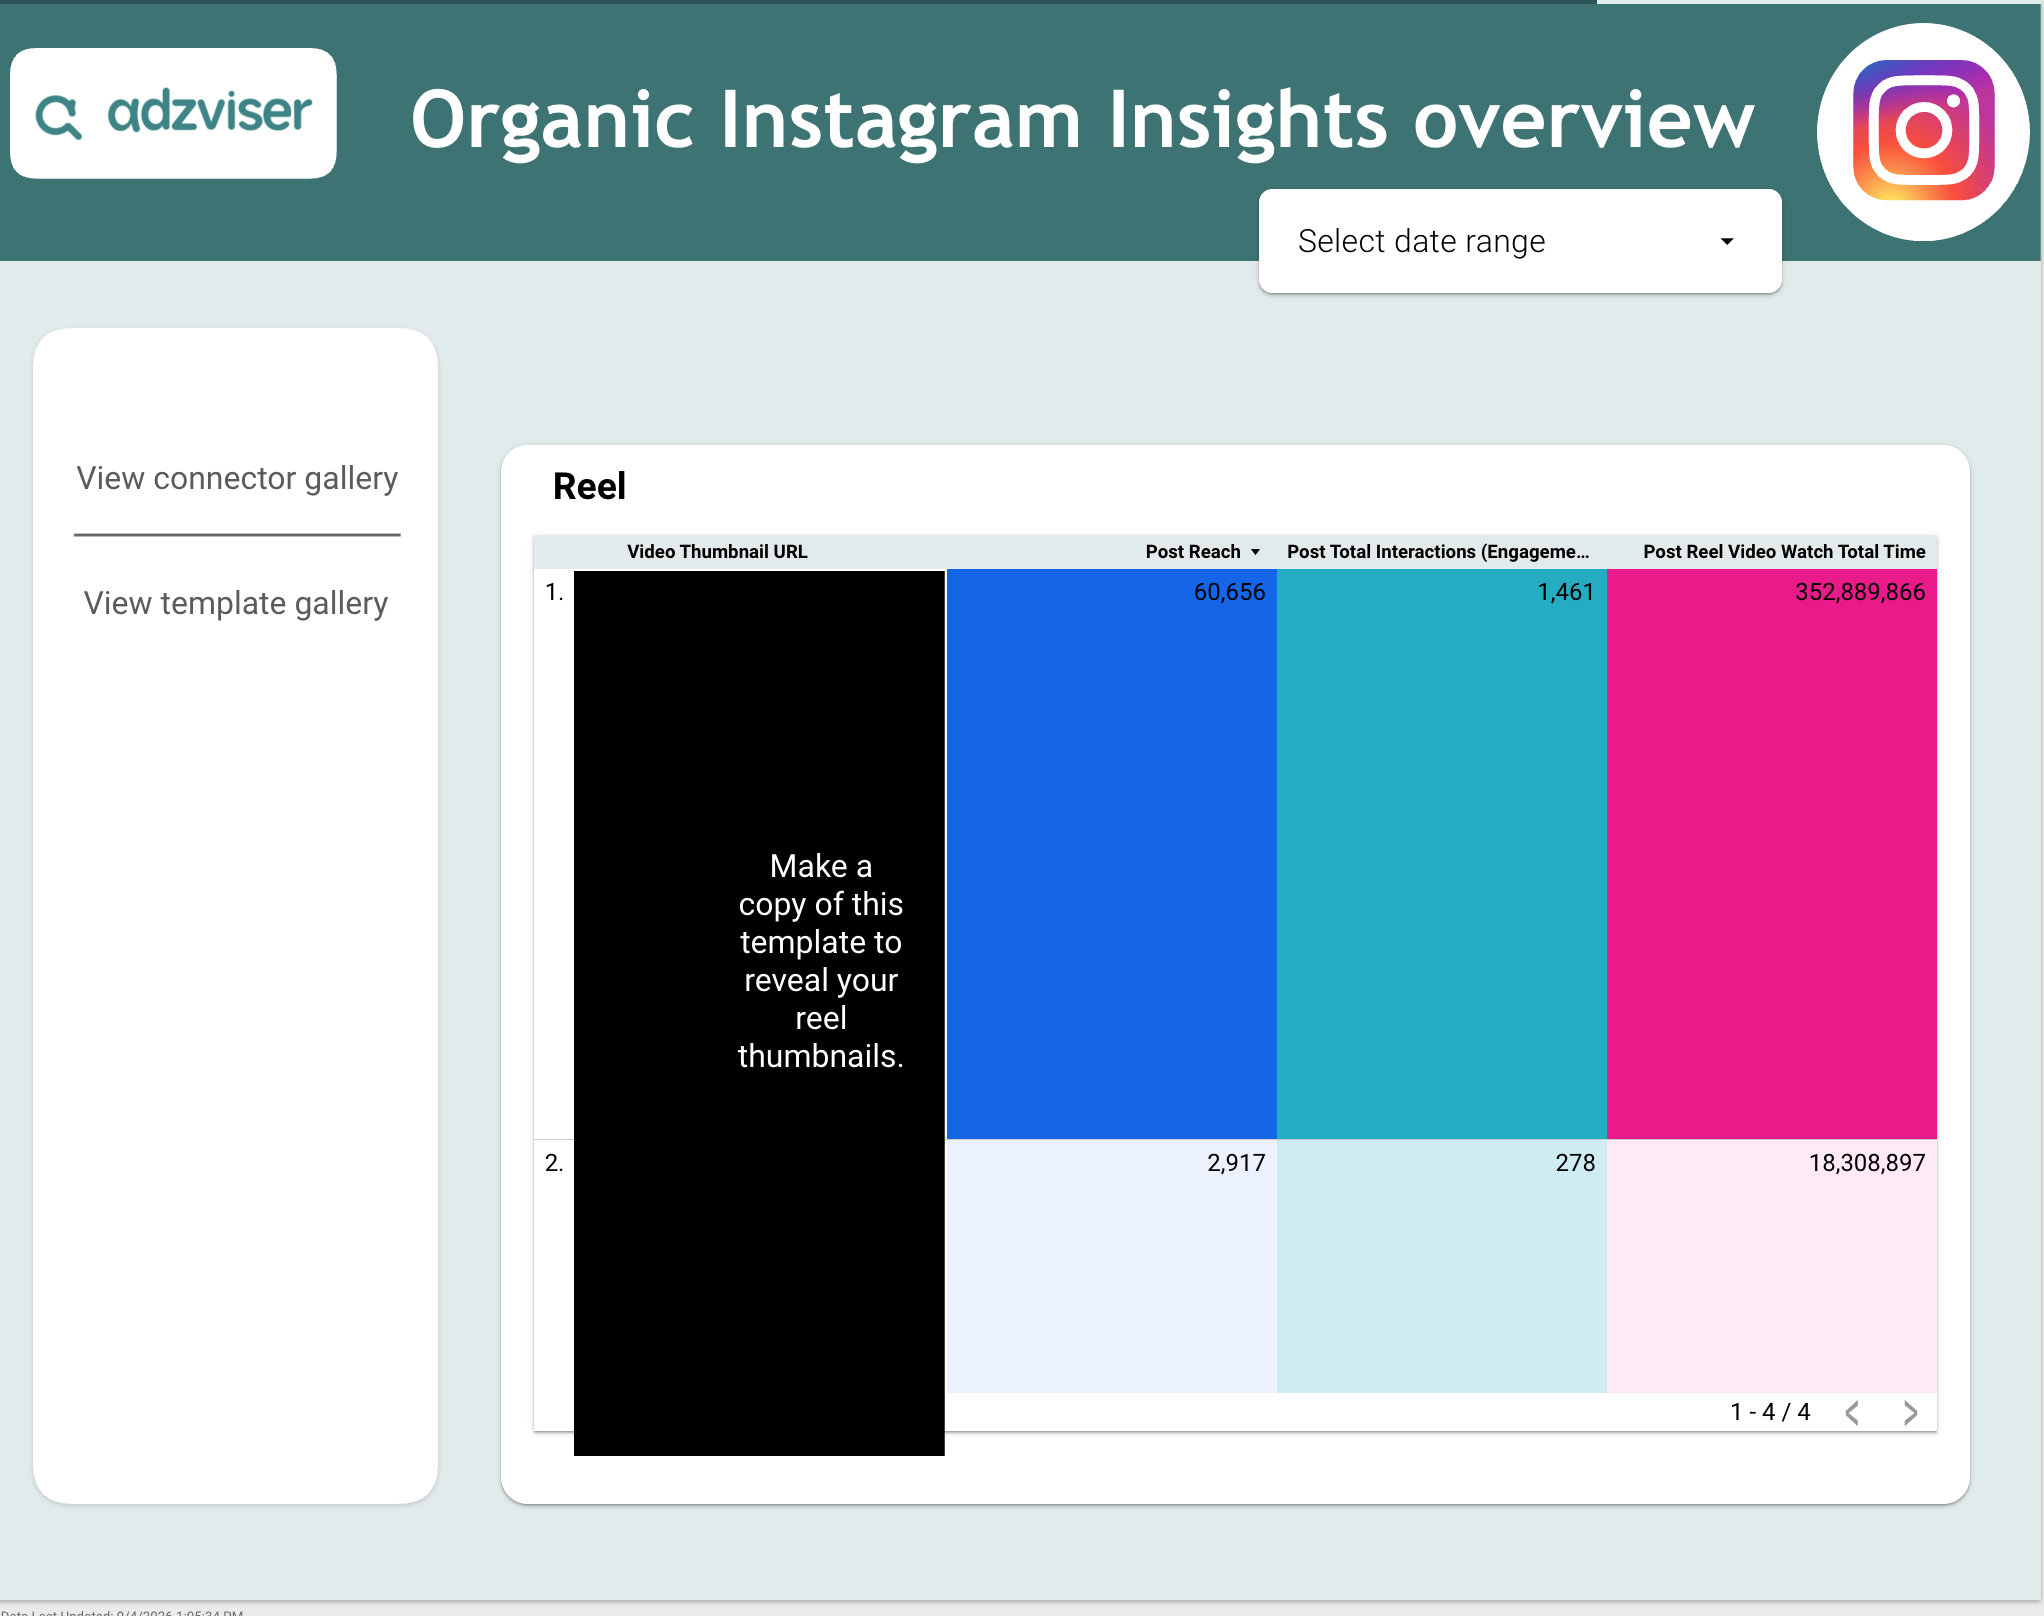


Organic Instagram Insights Overview
A two-page Instagram Insights dashboard for Data Studio — an overview page tracking profile followers, profile engagement, and post engagement with a profile reach breakdown chart and a top-posts table, plus a Reel performance page by reach, interactions, and watch time.
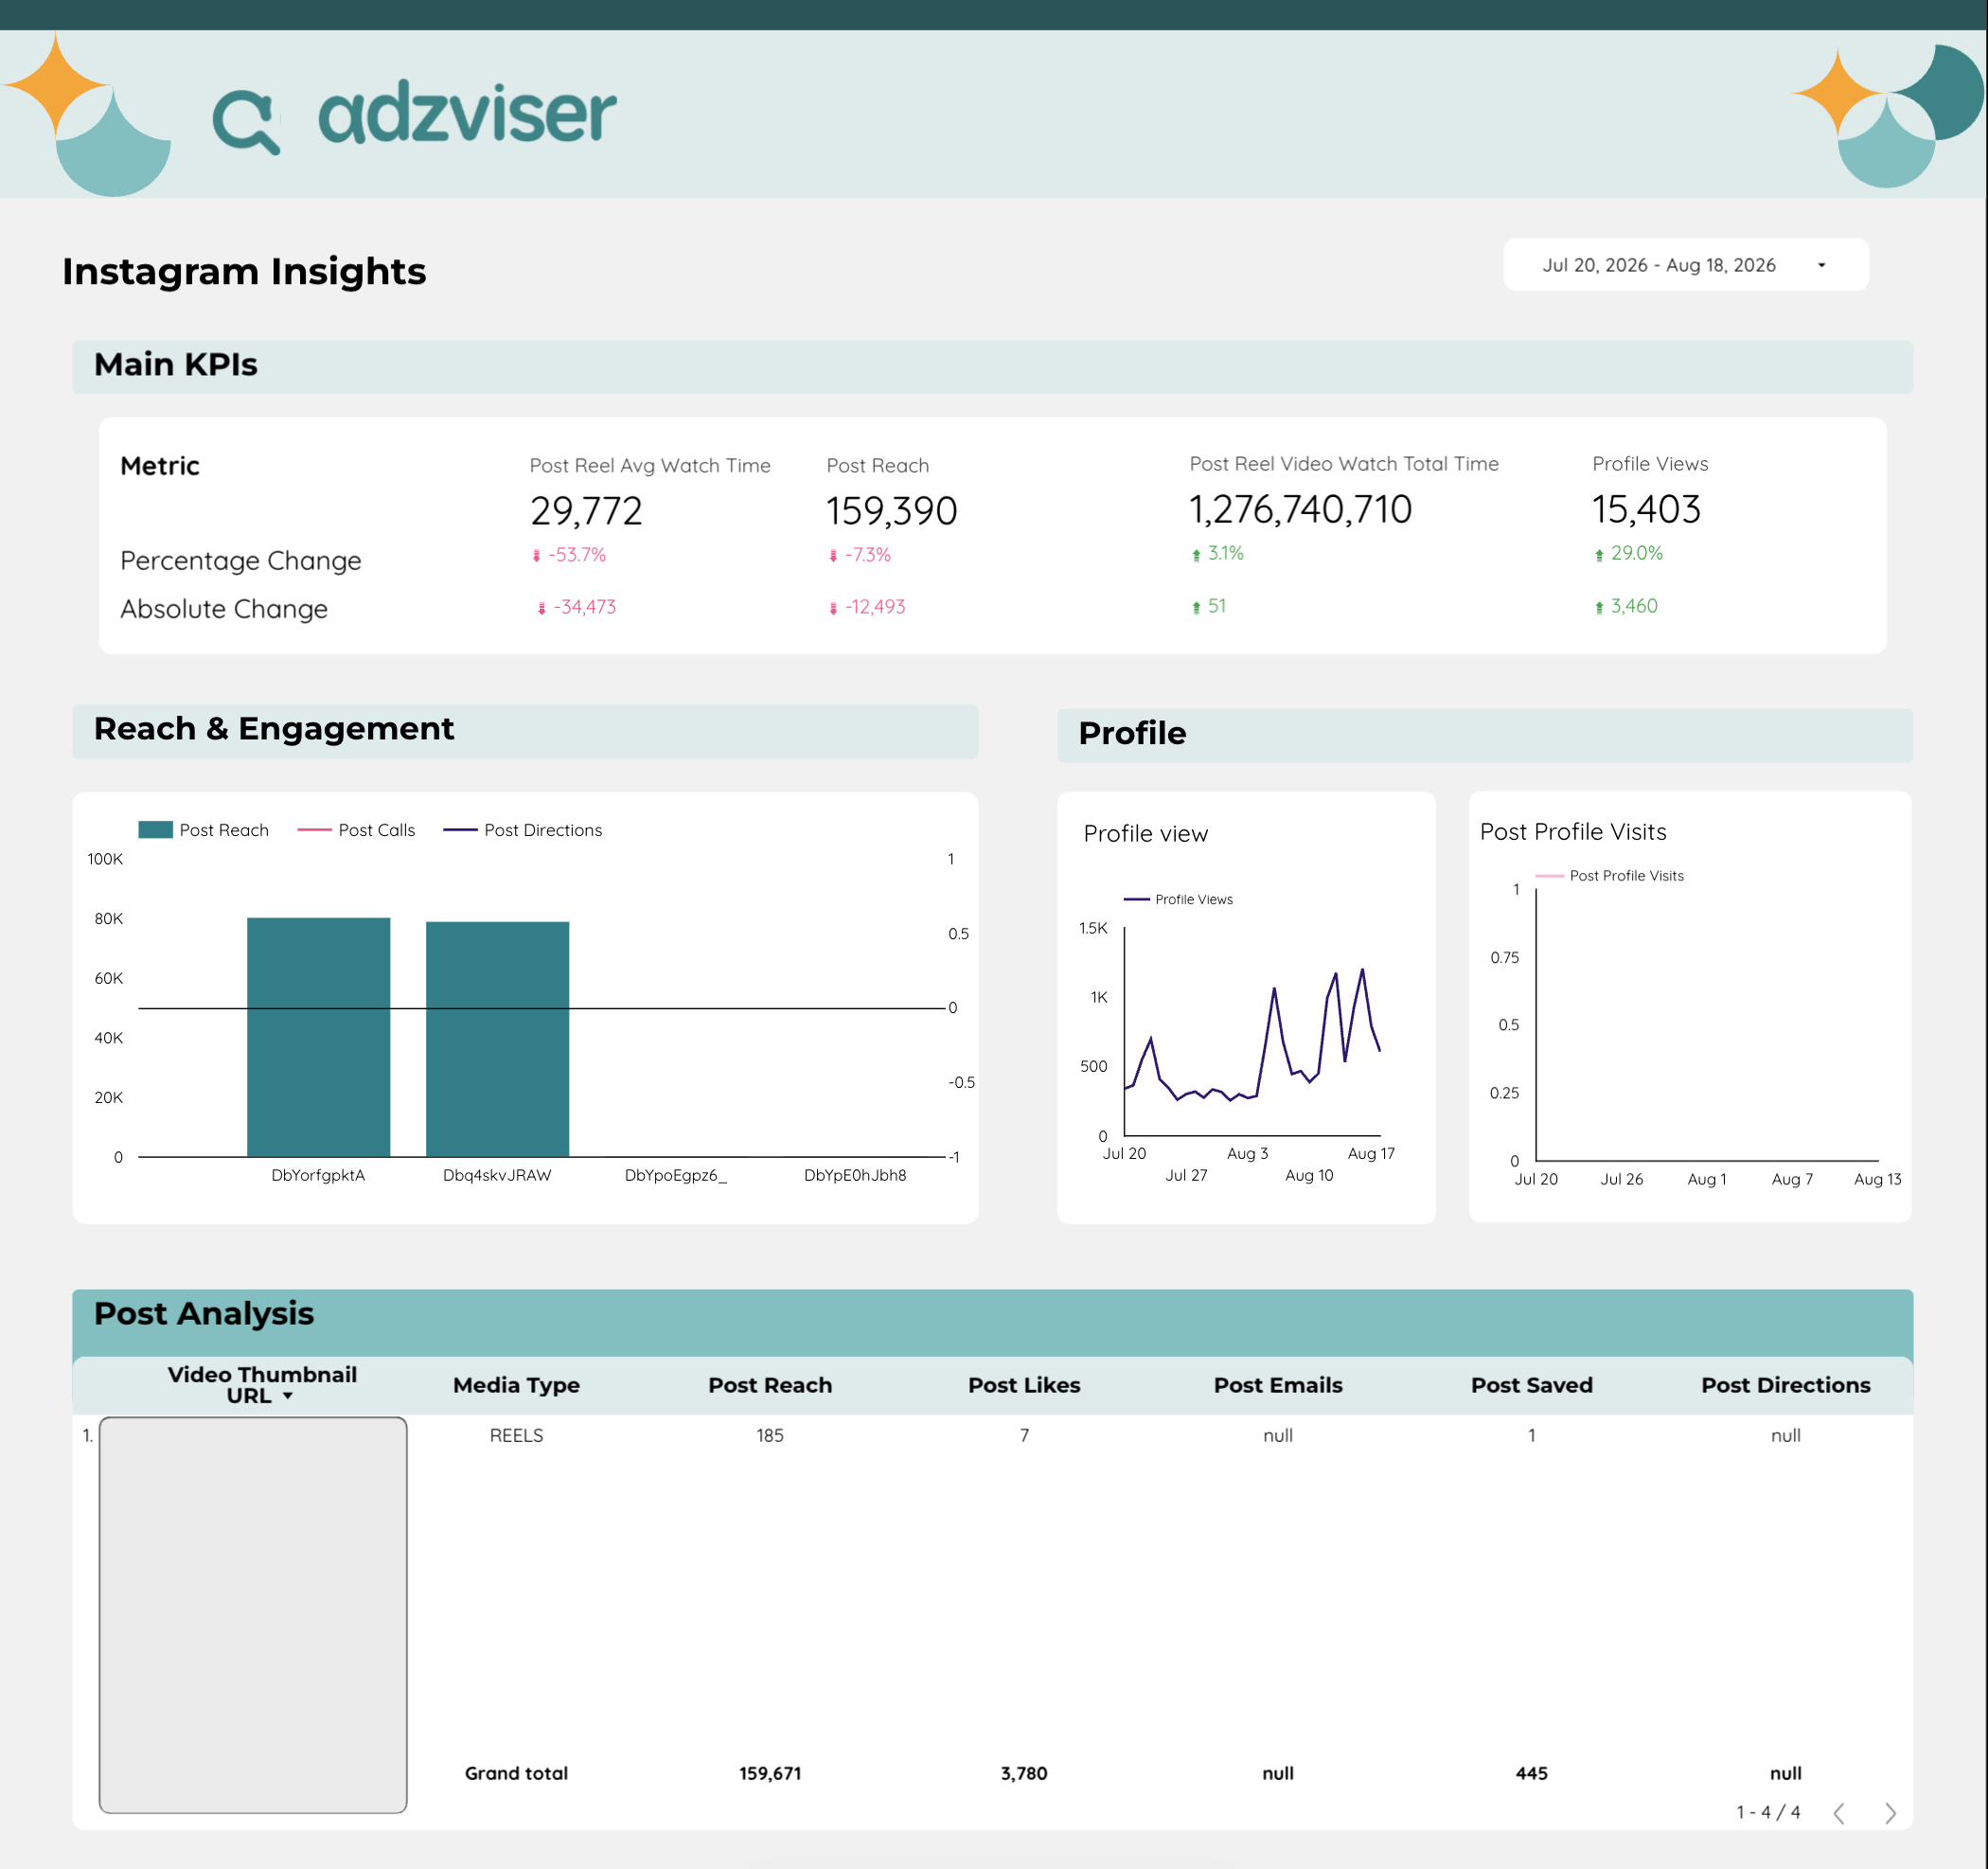
Instagram Insights Overview
An Instagram Insights dashboard for Data Studio — track profile views, post reach, and reel watch time at a glance, with reach & engagement charts, profile trend charts, and a post-level performance breakdown.
Instagram Insights Metrics and Dimensions Included
The available templates cover practical Instagram Insights performance fields, so you can analyze results without building every chart and table from scratch.
Popular metrics
- Profile Followers
- Profile Follows
- Profile Reach
- Profile Comments
- Profile Shares
- Profile Website Clicks
- Profile Likes
- Profile Saves
- Profile Reach Through Ad
- Profile Reach Through Feed
- Profile Reach Through Reels
- Profile Reach Through Story
Useful dimensions
- Date
- Media URL
- Video Thumbnail URL
- Media Type
How to Use an Instagram Insights Data Studio Template
Set up a live Instagram Insights dashboard in Data Studio with the same guided workflow used across Adzviser integrations.
Choose a template
Open the dashboard that best fits the Instagram Insights results you want to monitor.
Connect Instagram Insights
Authorize your account in Adzviser and select the accounts you want the template to report on. Explore the Instagram Insights connector →
Customize and share
Adjust date ranges, filters, charts, and branding directly in Data Studio. Learn about Data Studio →
Instagram Insights Data Studio Template FAQs
Make a copy of the dashboard, connect Instagram Insights to an Adzviser workspace, and replace the sample data source with your authorized Adzviser connector. Check each chart if any sample data remains. Open the Instagram Insights connector page →
The metrics and dimensions listed above are taken from the templates in this collection. Open an individual template to see its exact field set. You can then add or replace fields supported by the Instagram Insights connector.
Yes. Connect the required accounts to your Adzviser workspace. You can select or query multiple accounts, or keep a separate template copy for each client when you need independent filters, access, and branding.
Data Studio requests data through the connected Adzviser source and may cache it according to the data source's freshness setting. You can manually refresh the report when you need to request the latest available data.
Yes. Edit the copied dashboard to change charts, metrics, dimensions, date controls, filters, calculated fields, colors, logos, and pages.
Confirm that Instagram Insights is connected in Adzviser and that the copied report uses your Adzviser data source instead of the sample connection. Reconnect any chart that still points to the old source.
Yes. You can open, copy, and customize the templates for free. An Adzviser account is required when you replace the sample data with a live Instagram Insights connection.