Free Marketing Analytics Report Templates
Use ready-made reports to evaluate website acquisition, engagement, call tracking, lead performance, and the channels driving measurable results.
Browse Marketing analytics templates
Preview the report, review its included fields, and choose the Data Studio dashboard or Google Sheets workflow that matches your reporting needs.
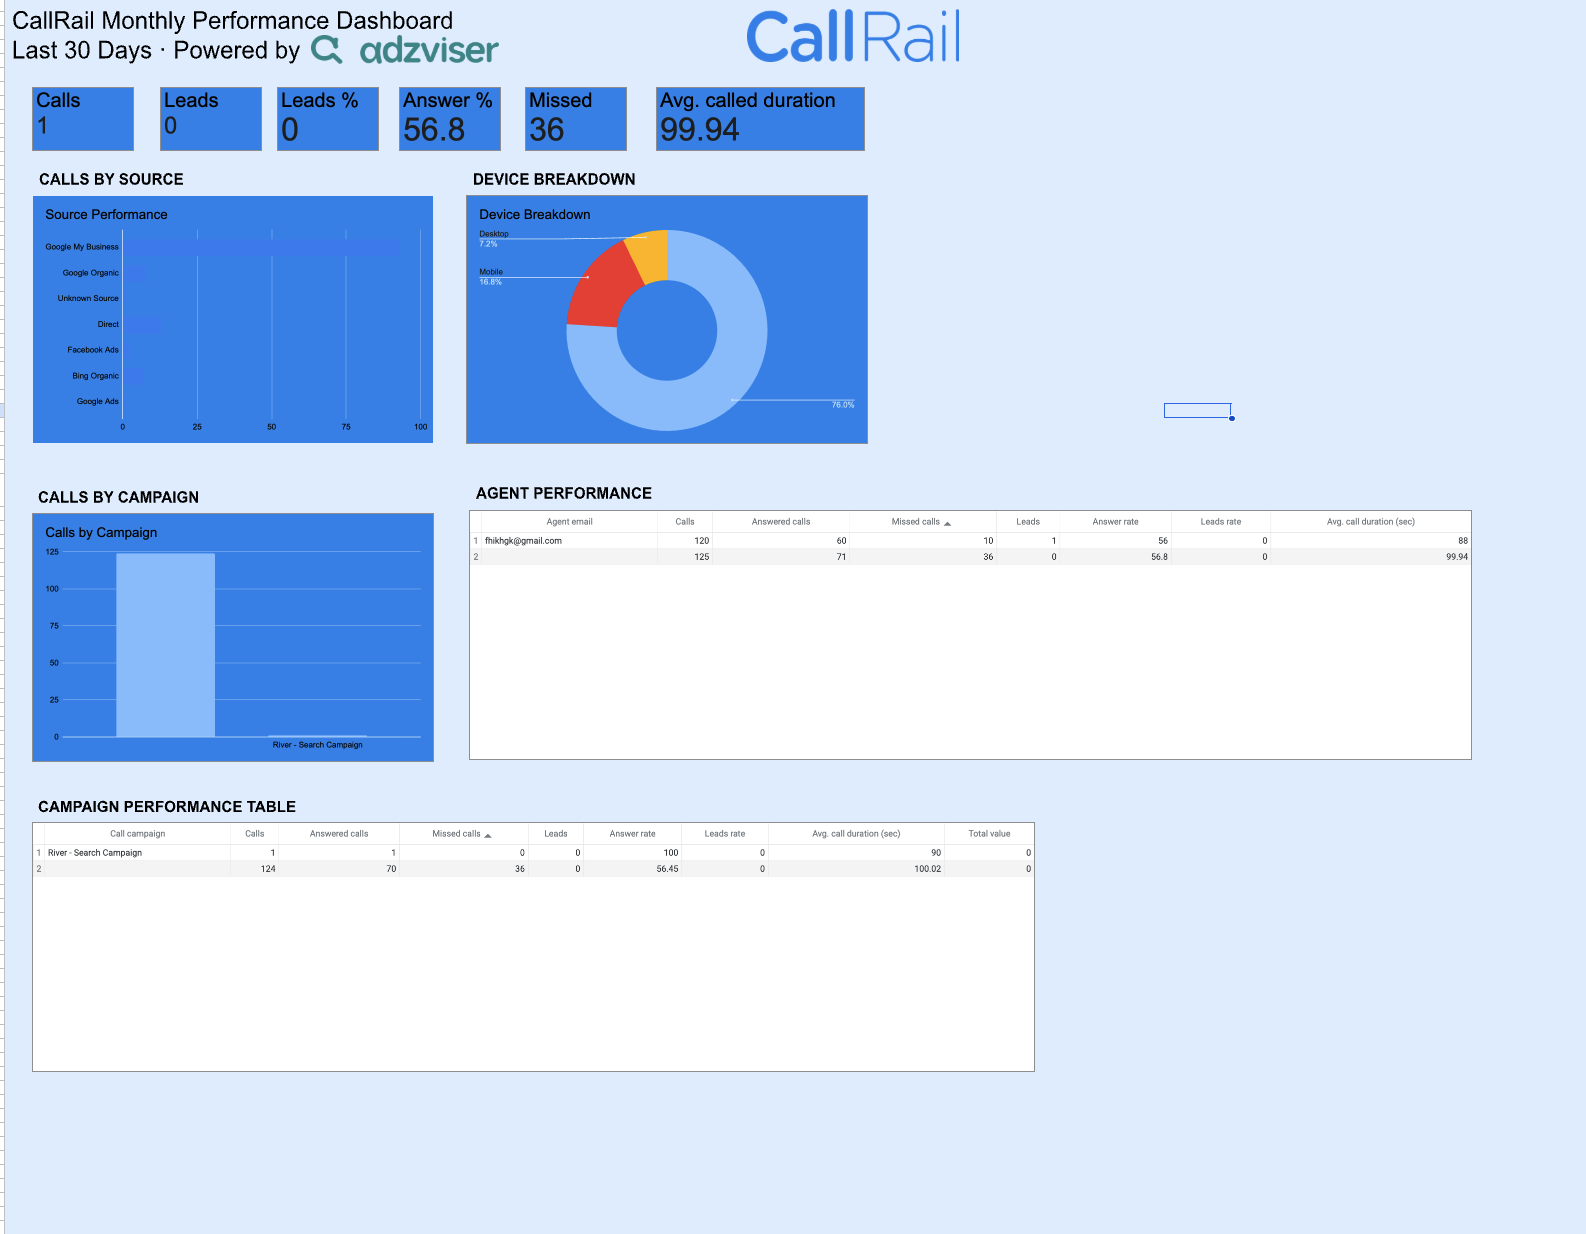


CallRail Monthly Performance Dashboard
A CallRail monthly performance report for Google Sheets — track calls, leads, answer rate, missed calls, and average call duration at a glance, with source performance, device breakdown, and calls-by-campaign charts, per-agent and per-campaign tables, plus a raw call-level log with tracking and UTM data and a form submissions tab.
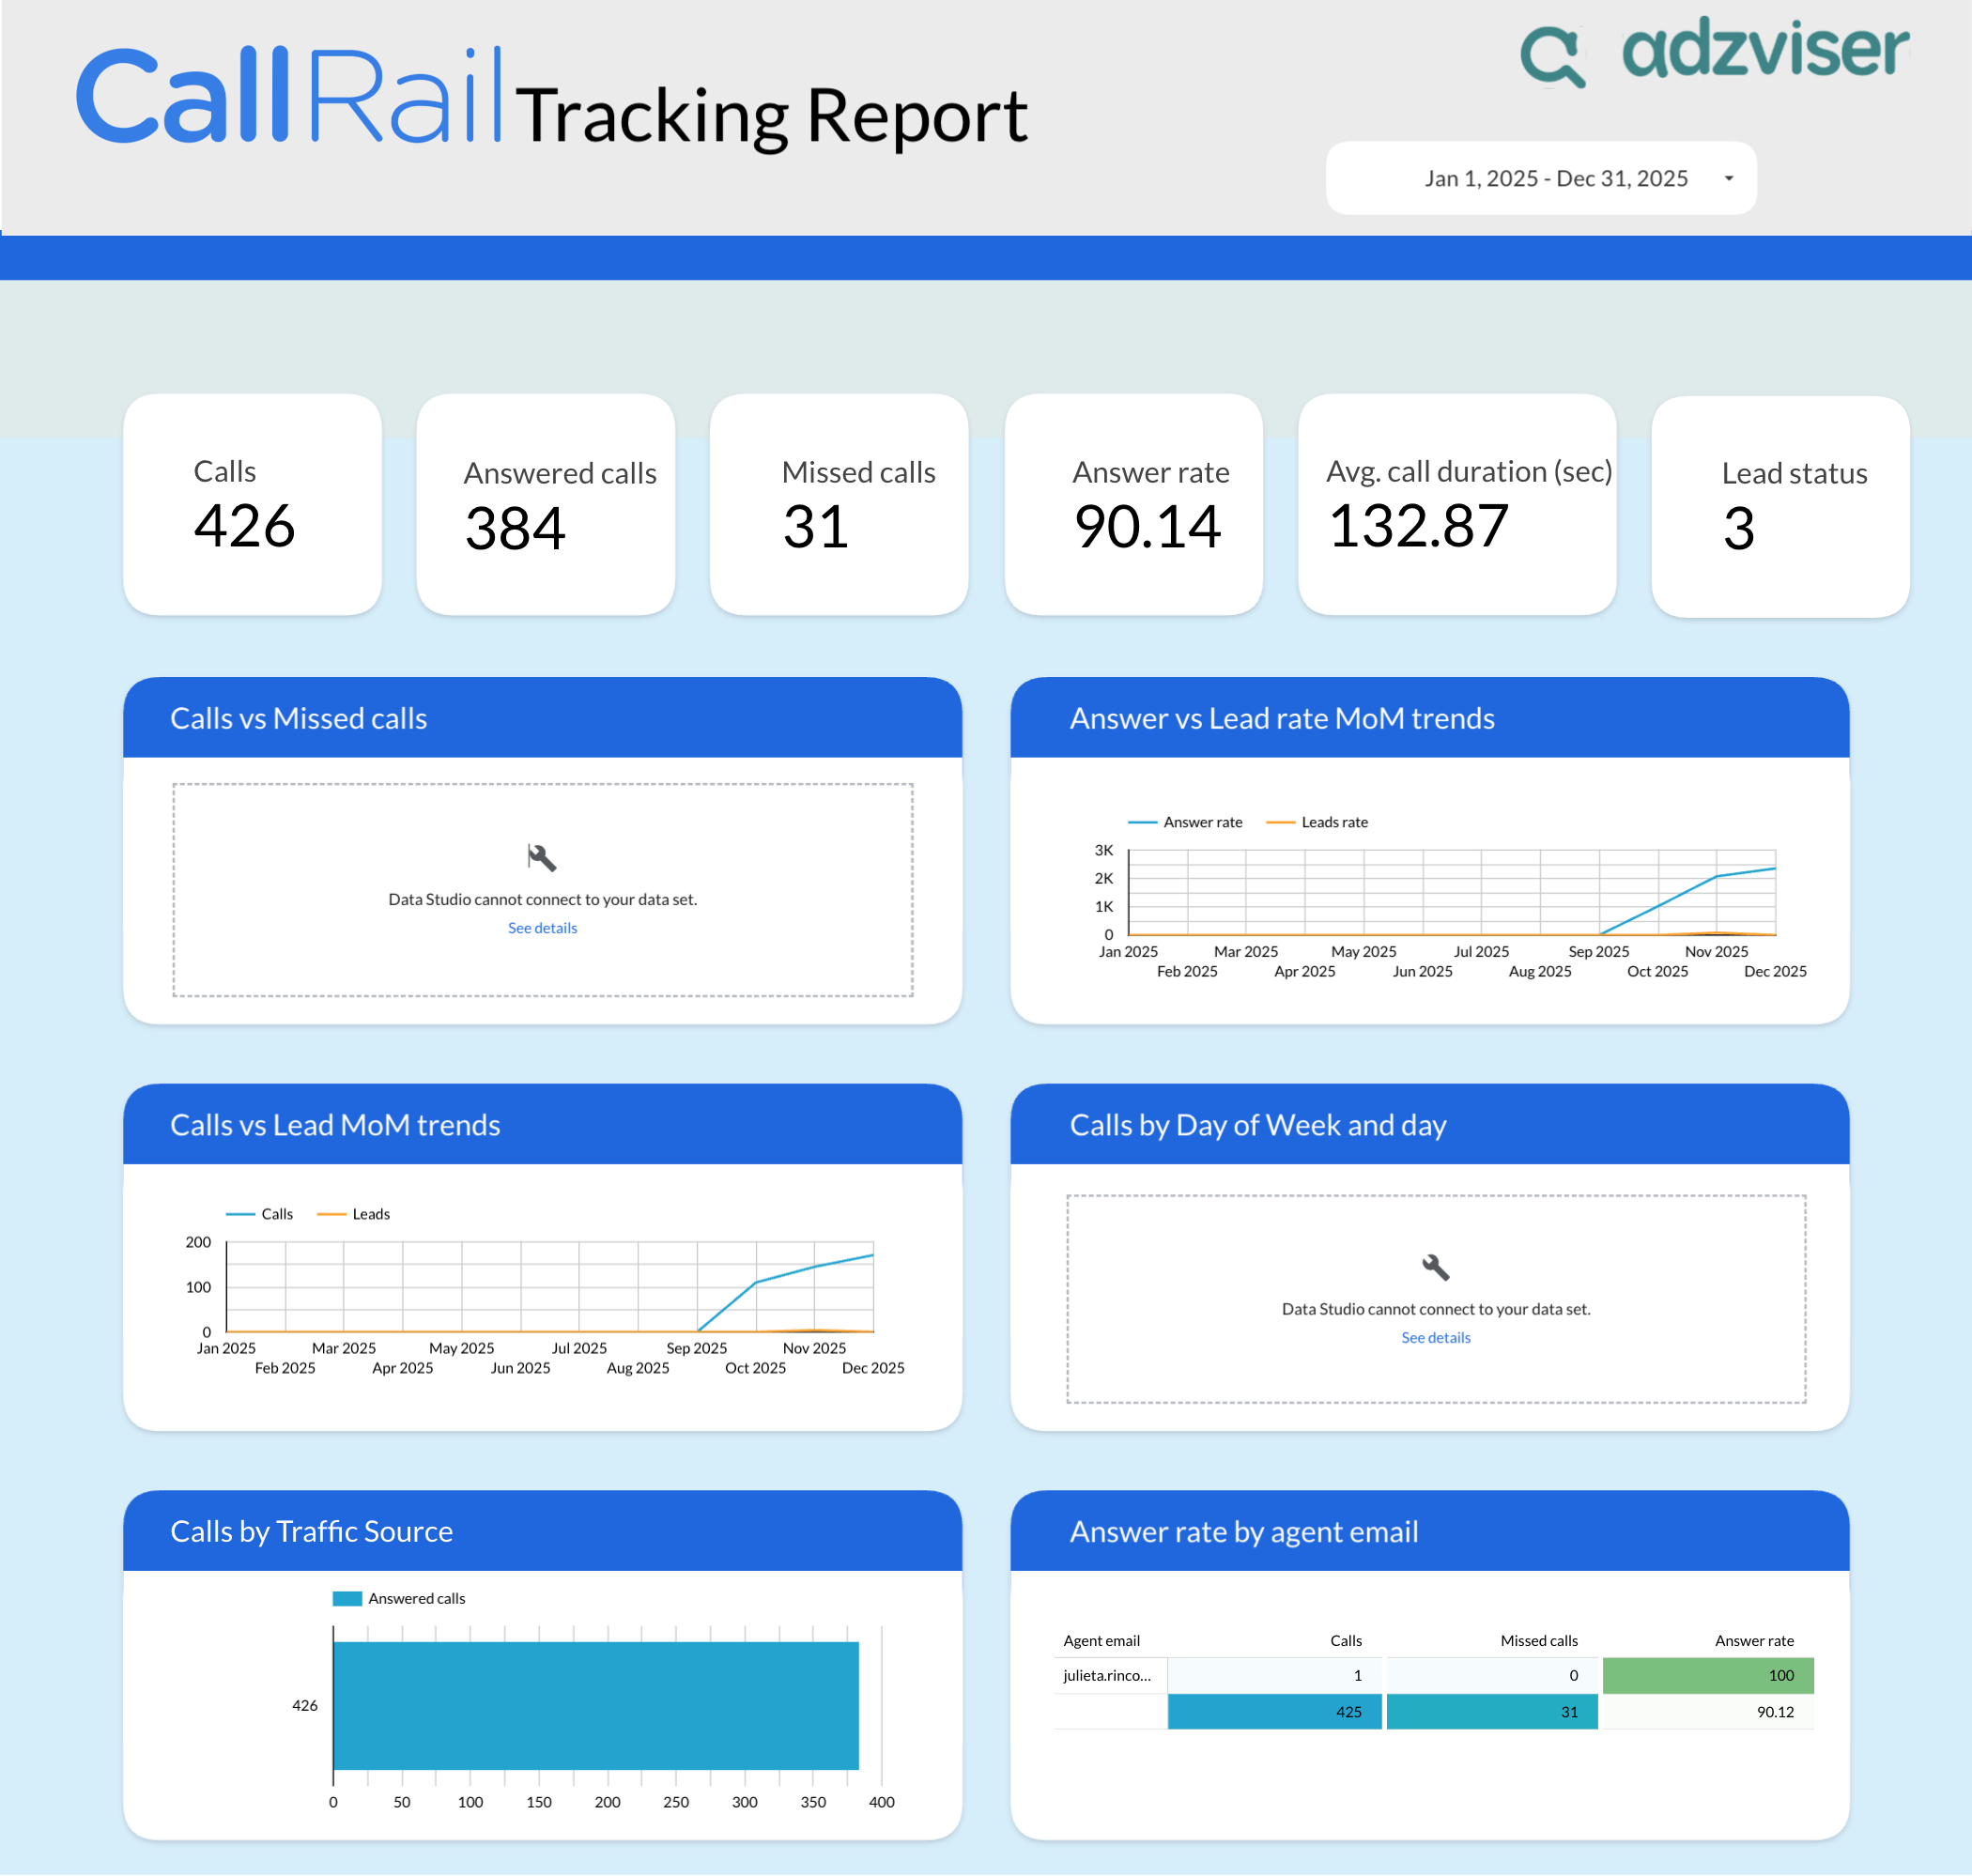

CallRail Tracking Report
A CallRail tracking dashboard for Data Studio — track calls, answered/missed calls, and answer rate at a glance, with month-over-month call and lead trends, a traffic source breakdown, and answer rate by agent.
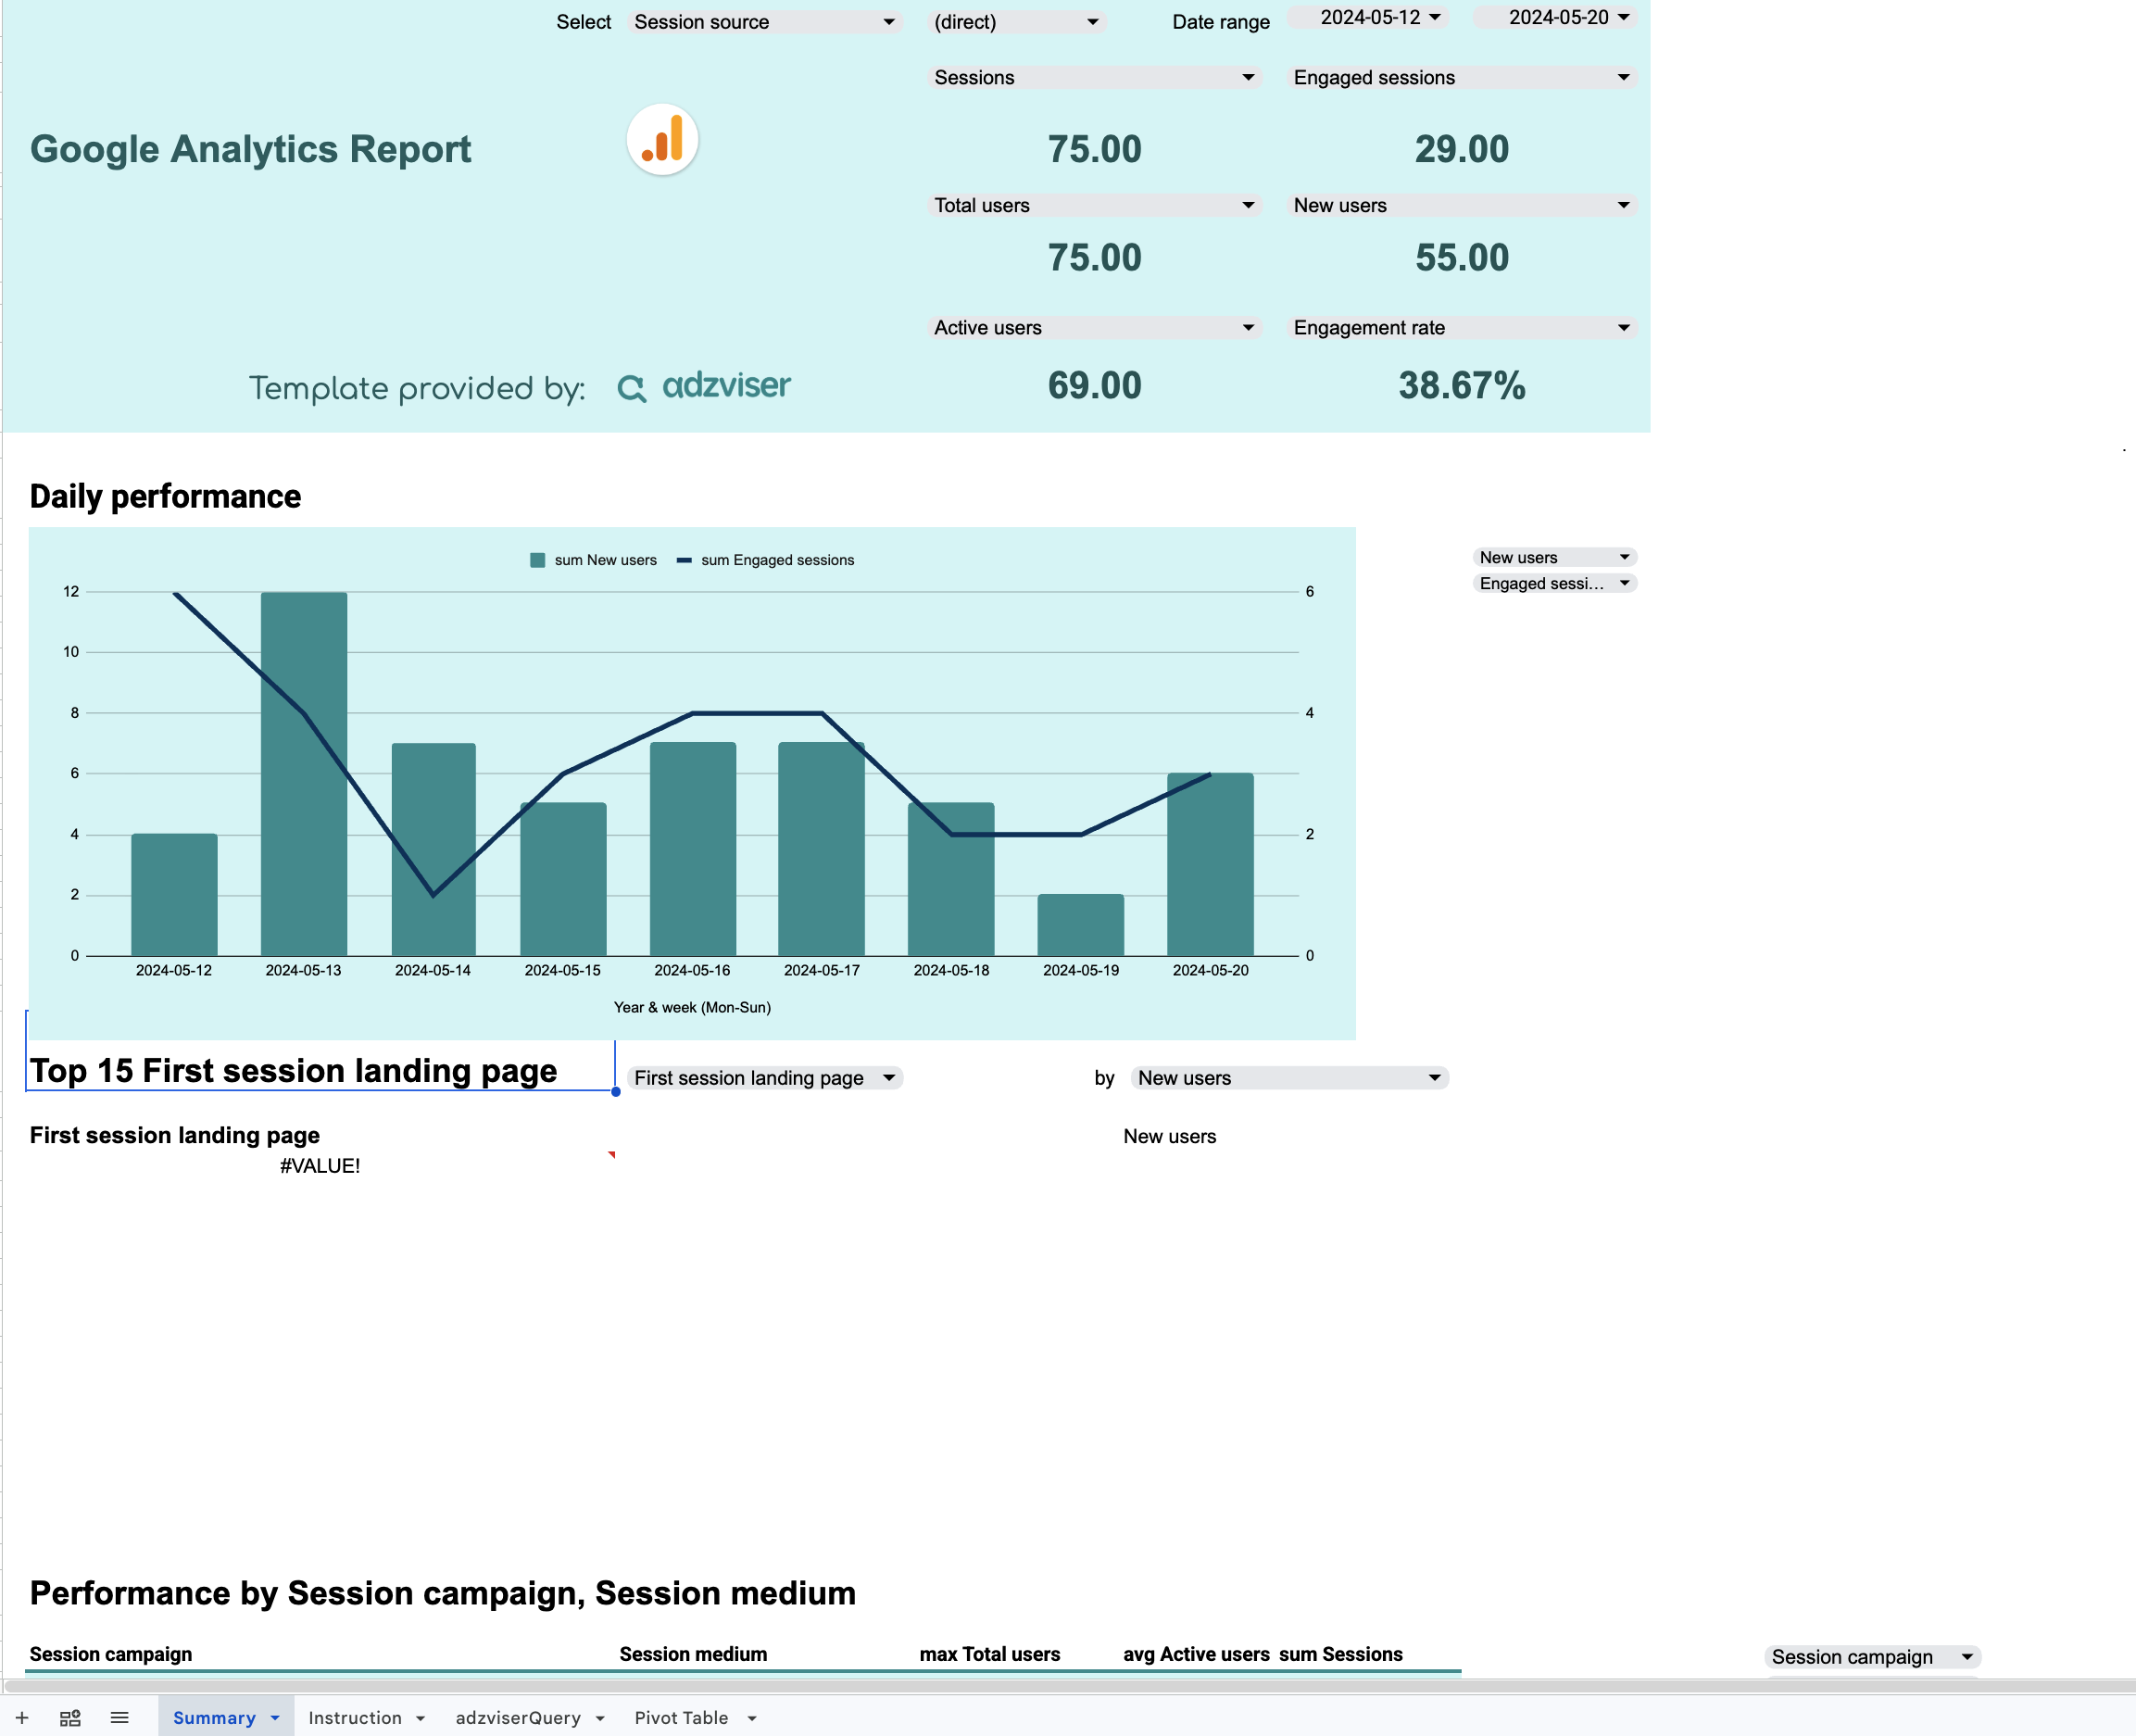

Google Analytics Report Template
A Google Analytics 4 report for Google Sheets — track sessions, engaged sessions, total users, new users, active users, and engagement rate at a glance, with a daily performance trend chart, a top-15 landing pages table, and a breakdown by session campaign and medium.
Use the template where your team already works
Use Data Studio for interactive dashboards and stakeholder reporting, or Google Sheets for formulas, pacing calculations, pivot tables, and operational analysis. Each template connects to supported live data through Adzviser.
Browse Data Studio templates → · Browse Google Sheets templates →