Marketing Measurement for Small and Mid-Size Teams: A Practical Guide
- What is marketing measurement?
- Why the standard playbook does not fit smaller teams
- The three questions your measurement should answer
- How to measure marketing success, step by step
- Content marketing measurement
- Metrics that matter and metrics that waste your time
- Four mistakes that cost teams the most
- Putting it together without a data team
Most advice about marketing measurement is written for companies with a data team, a seven-figure ad budget, and a vendor on retainer. That is not most of us.
This guide covers how marketing measurement actually works when you have a handful of channels, a modest budget, and nobody whose full-time job is analytics.
What is marketing measurement?
Marketing measurement is the practice of connecting what you spend and publish to what the business actually gets back, so you can decide what to do more of, what to change, and what to stop.
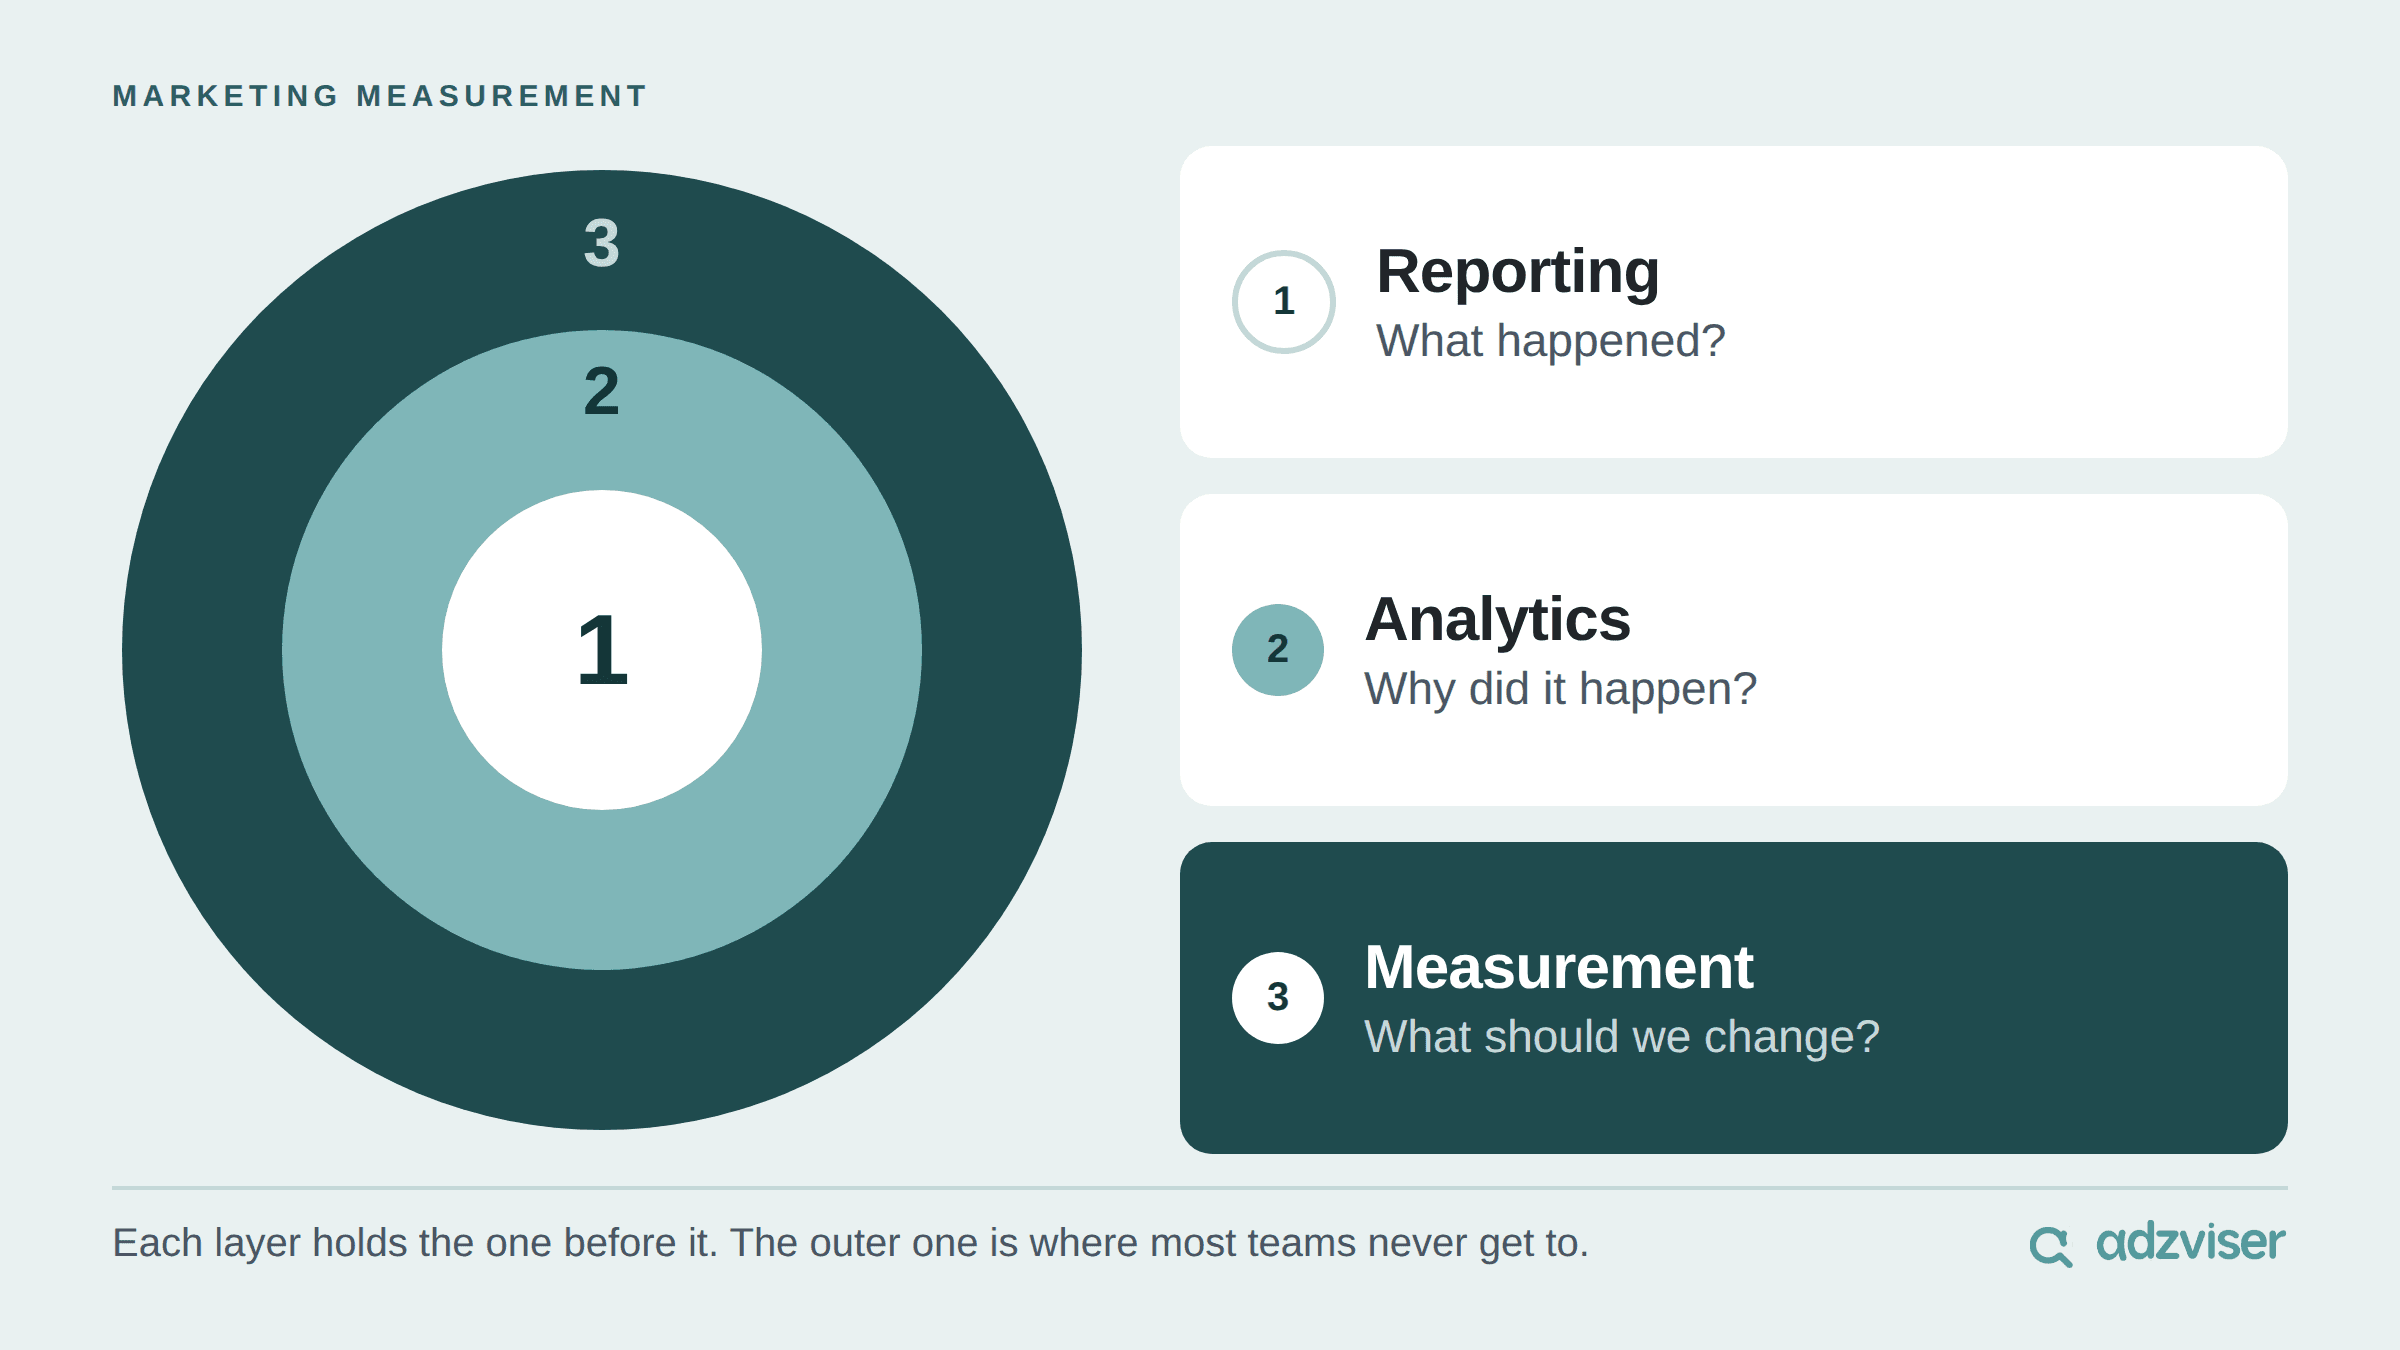
It is worth separating three words that often get used interchangeably:
- Reporting describes what happened. You spent $9,400 last month, generated 212 signups, and paid $44 per signup.
- Analytics digs into why. Search generated signups more cheaply than social, and most of the qualified ones came from three campaigns.
- Measurement asks the bigger question: how much did the marketing actually contribute, and what should you do differently because of it?
That last question is the hardest. A dashboard can show that a channel has a great CPA while the channel is partly taking credit for customers who might have converted anyway.
Good marketing measurement means treating platform-reported performance as useful evidence, not unquestionable truth.
Why the standard playbook does not fit smaller teams
Open most advanced guides on marketing measurement and you will eventually run into multi-touch attribution, incrementality testing, and marketing mix modeling.
All three can be useful, but they also come with requirements that smaller teams may not have. Marketing mix modeling generally becomes more useful when there is enough historical data and meaningful variation in spend. Formal lift studies may require significant volume, platform eligibility, or outside expertise. Multi-touch attribution depends on tracking customer journeys across channels and devices, which has become increasingly difficult as privacy protections have expanded.
If you are spending $5,000 or $50,000 a month across four or five channels, these methods are not necessarily off limits. They are simply not where most teams need to start.
Start with one clearly defined business outcome, reliable tracking, a small number of useful metrics, and a habit of testing the assumptions behind your dashboard.
Smaller teams also have an advantage: there are fewer moving parts. You can often change one thing, observe the result, and learn faster than an organization managing hundreds of campaigns across dozens of markets.
The three questions your measurement should answer
Any marketing measurement setup worth keeping should help answer three questions.
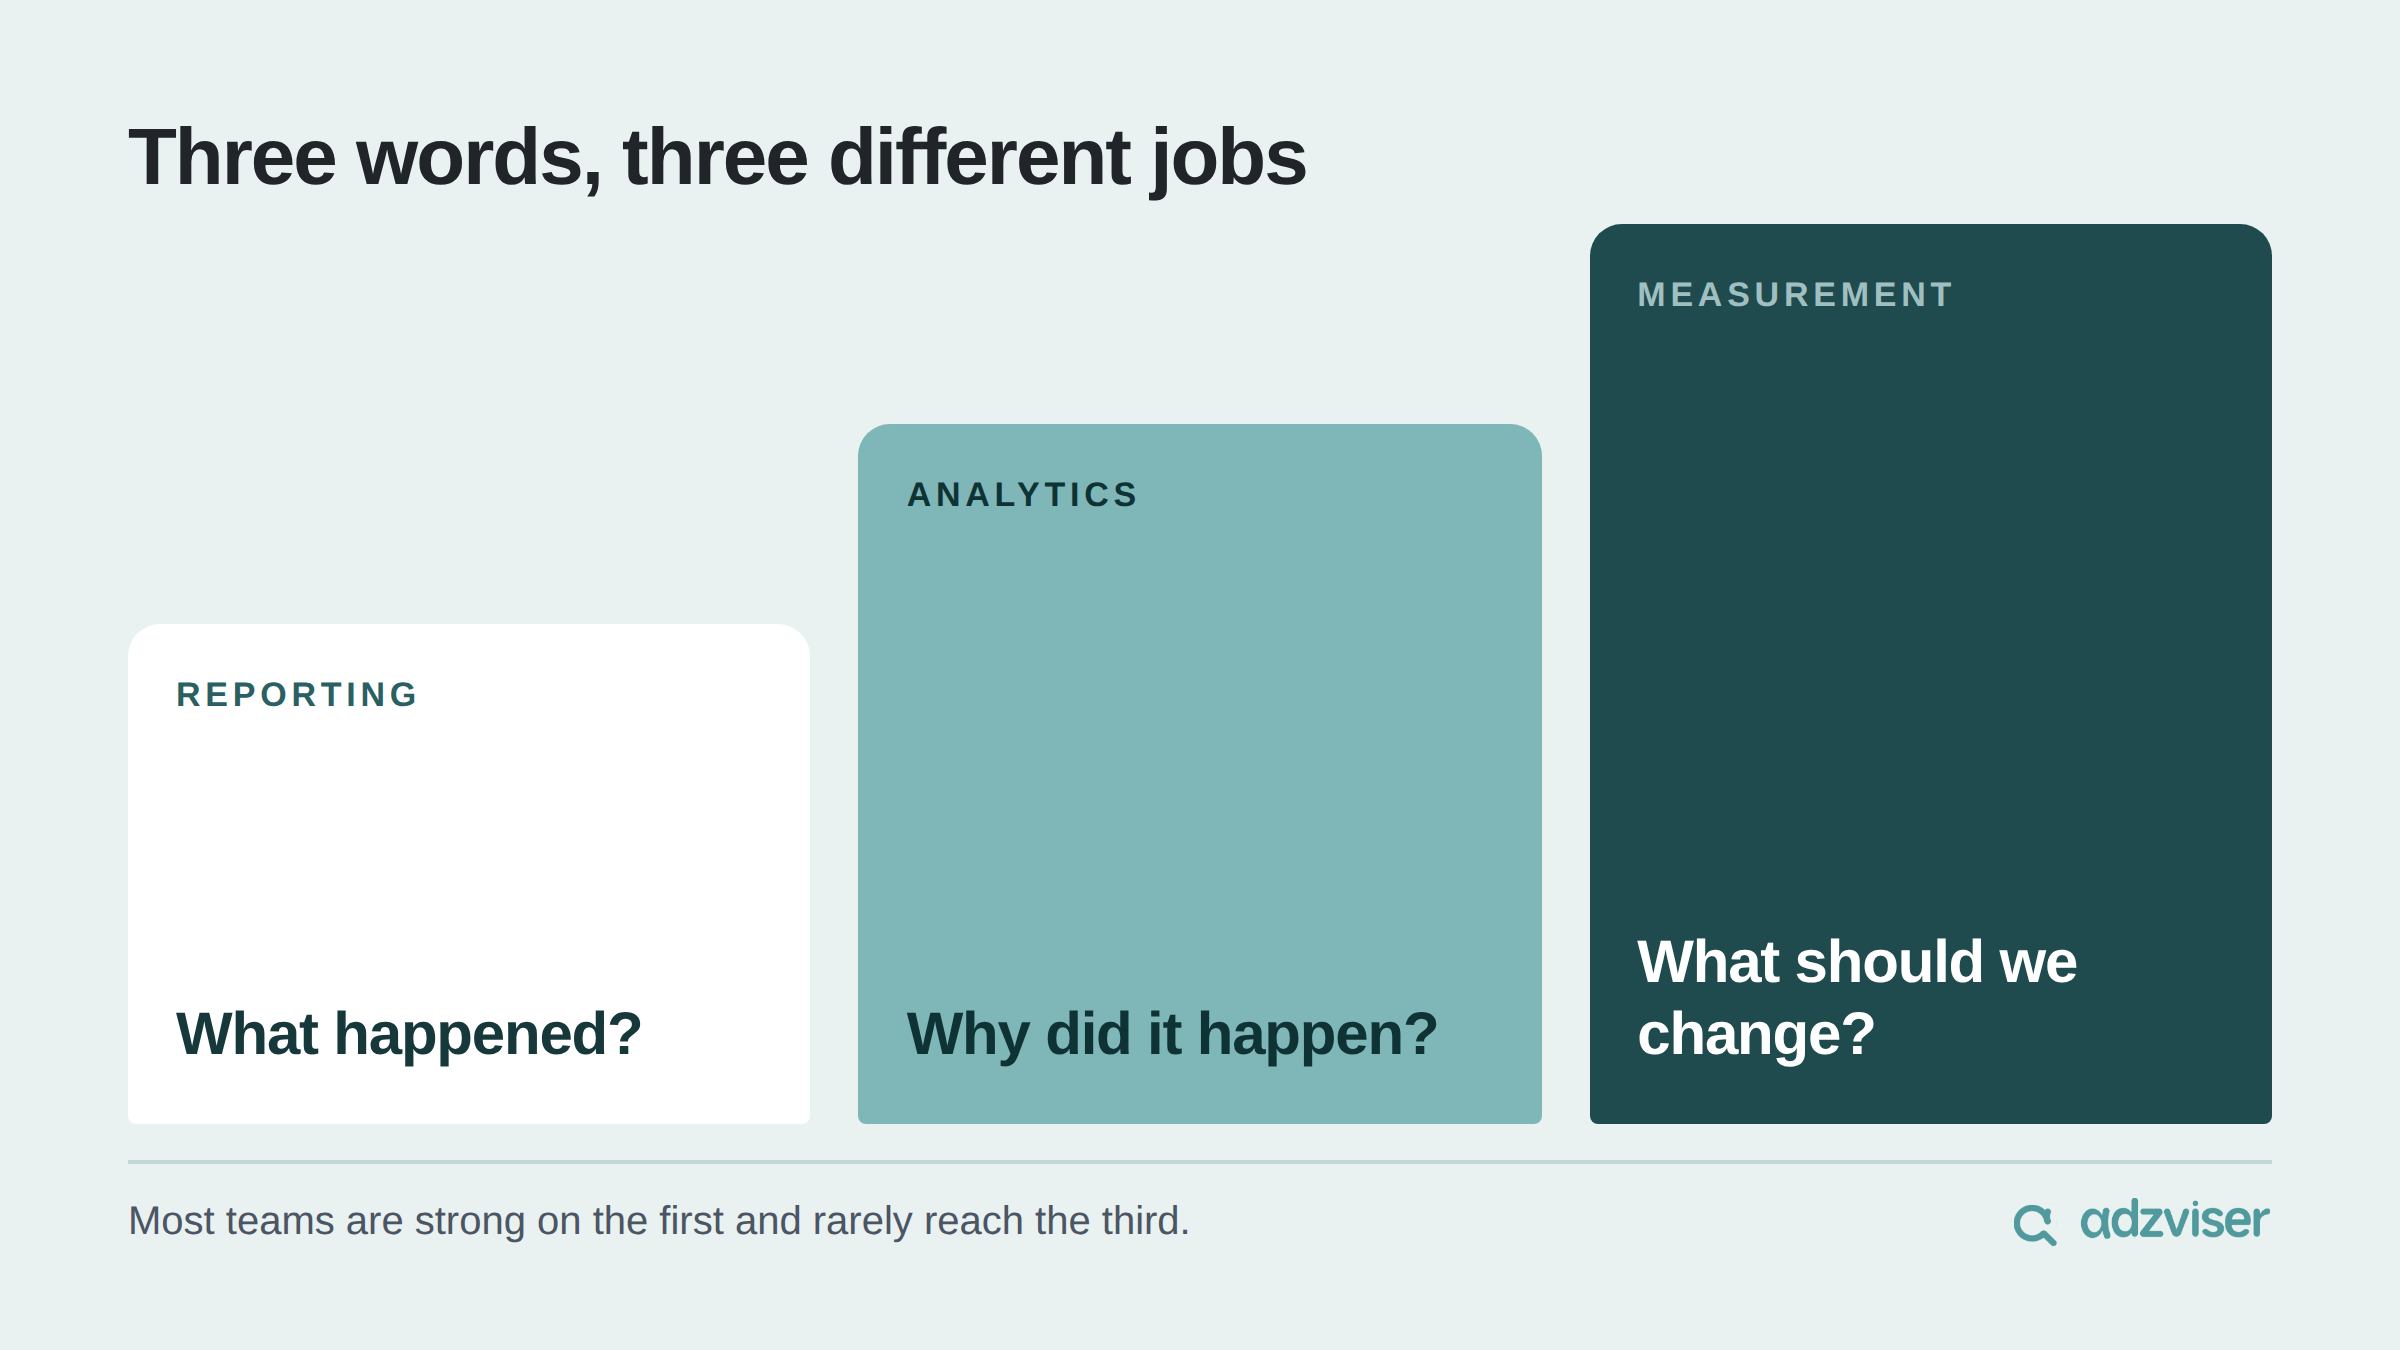
What happened?
How much did you spend? How much traffic, leads, or revenue did you generate? Which channels and campaigns produced them?
This is the reporting layer, and software can automate most of it.
Why did it happen?
This is where breakdowns become useful. The same $44 cost per signup can look very different when you break it down by campaign, device, region, audience, or creative.
Aggregate numbers often hide the thing you actually need to see.
What should we change?
This is where measurement becomes harder.
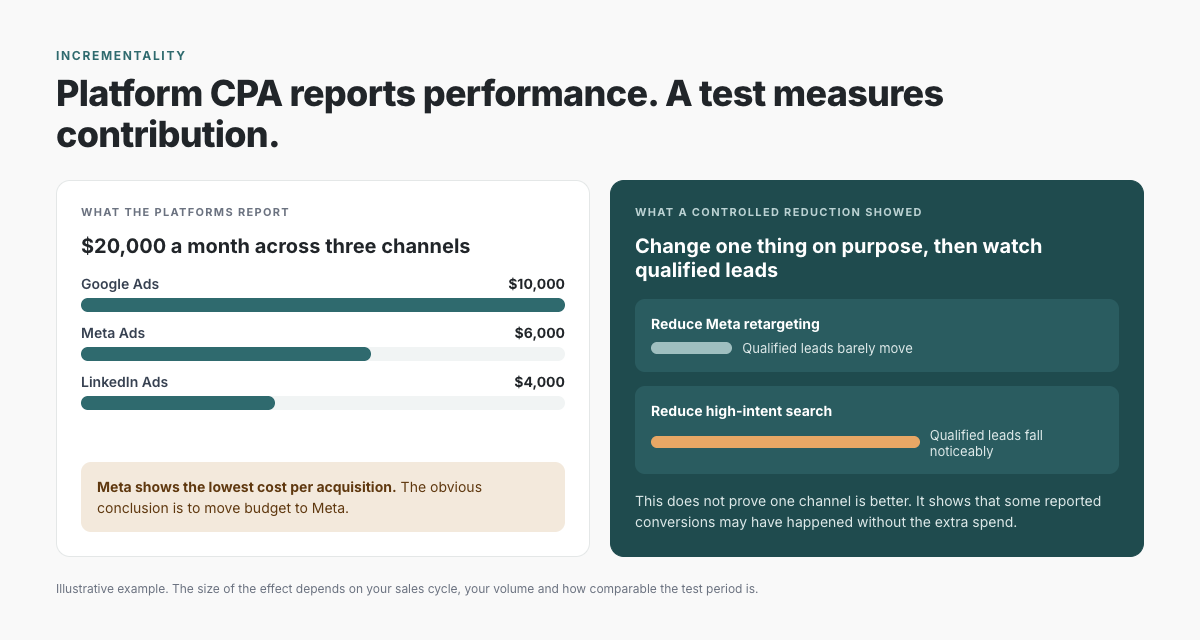
Suppose you spend $20,000 a month:
- $10,000 on Google Ads
- $6,000 on Meta Ads
- $4,000 on LinkedIn Ads
Meta reports the lowest cost per acquisition, so the obvious conclusion is to give Meta more budget.
But then you reduce a portion of your Meta retargeting spend for a controlled period and total qualified leads barely move. When you reduce high-intent search spend, qualified leads fall noticeably.
That does not automatically prove one channel is better. But it gives you information the platform CPA could not: some of the Meta conversions may have happened without the additional ad spend.
That is the difference between reporting performance and measuring contribution.
Most teams are good at the first question, decent at the second, and spend far less time on the third. If you improve one thing in your measurement process, make it your ability to connect a number to a decision.
How to measure marketing success, step by step
If I were setting up marketing measurement from scratch, this is the sequence I would follow.
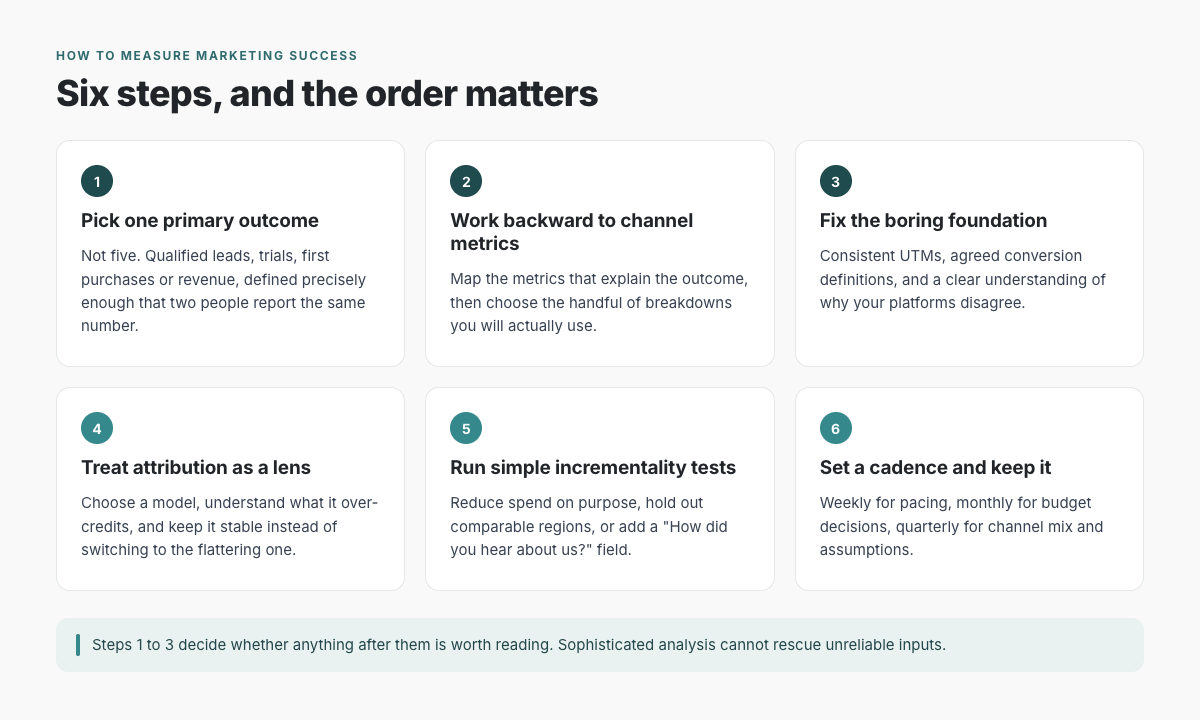
1. Pick one primary outcome and define it precisely
Pick one primary outcome, not five. It could be:
- Qualified leads
- Trials started
- First purchases
- New customers
- Revenue
Choose the outcome closest to business value that you can measure reliably, then define exactly what counts.
Does a trial that cancels the next day count? Does a returning customer count as a new purchase? Does every form submission count as a lead, or only one that meets certain criteria?
Without a shared definition, two people can report different results for the same month and both believe they are correct.
Everything else should help explain movement in that primary outcome.
2. Work backward to channel-level metrics
Once the outcome is fixed, map the metrics that help explain it.
For paid channels, that may include:
- Spend
- Impressions
- Clicks
- Cost per click
- Conversions
- Cost per acquisition
- Conversion rate
If you need a starting point for how to structure those reports, Adzviser also has paid media dashboard and report templates for platforms such as Google Ads, Meta Ads, LinkedIn Ads, Microsoft Ads, and TikTok Ads.
For organic search, useful metrics may include organic sessions, search impressions, rankings, and landing-page conversion rate. For email, you might look at deliveries, clicks, conversions, and revenue or leads generated.
Then choose the breakdowns you will actually use: campaign, channel, region, device, audience, landing page, or creative.
You do not need every available dimension. A report with 40 breakdowns and no clear question is just a more sophisticated way to get lost in the data.
3. Fix the boring foundation first
This is the step everyone wants to skip, and it determines whether the rest of the analysis is worth anything.
Use a consistent UTM convention and document it somewhere the team can find. Then make sure the basics are aligned:
- Agree on what counts as a conversion.
- Check that the same important events are being tracked consistently.
- Understand how consent settings and privacy controls affect your analytics data.
- Expect your ad platforms and analytics tools to disagree.
Google Ads, Meta Ads, LinkedIn Ads, Google Analytics 4 (GA4), your CRM, and your ecommerce platform may all use different attribution rules, conversion windows, identities, and event definitions.
The goal is not necessarily to make every number identical. The goal is to understand why they differ.
Sophisticated analysis cannot rescue unreliable inputs.
4. Treat attribution as a lens, not the truth
Every attribution model answers the question differently:
- Last click gives most or all of the credit to the final measurable interaction, which can make branded search, direct-response channels, and retargeting look especially strong.
- First click emphasizes discovery by giving credit to the first measurable interaction.
- Linear and time-decay models distribute credit across multiple touches according to predefined rules.
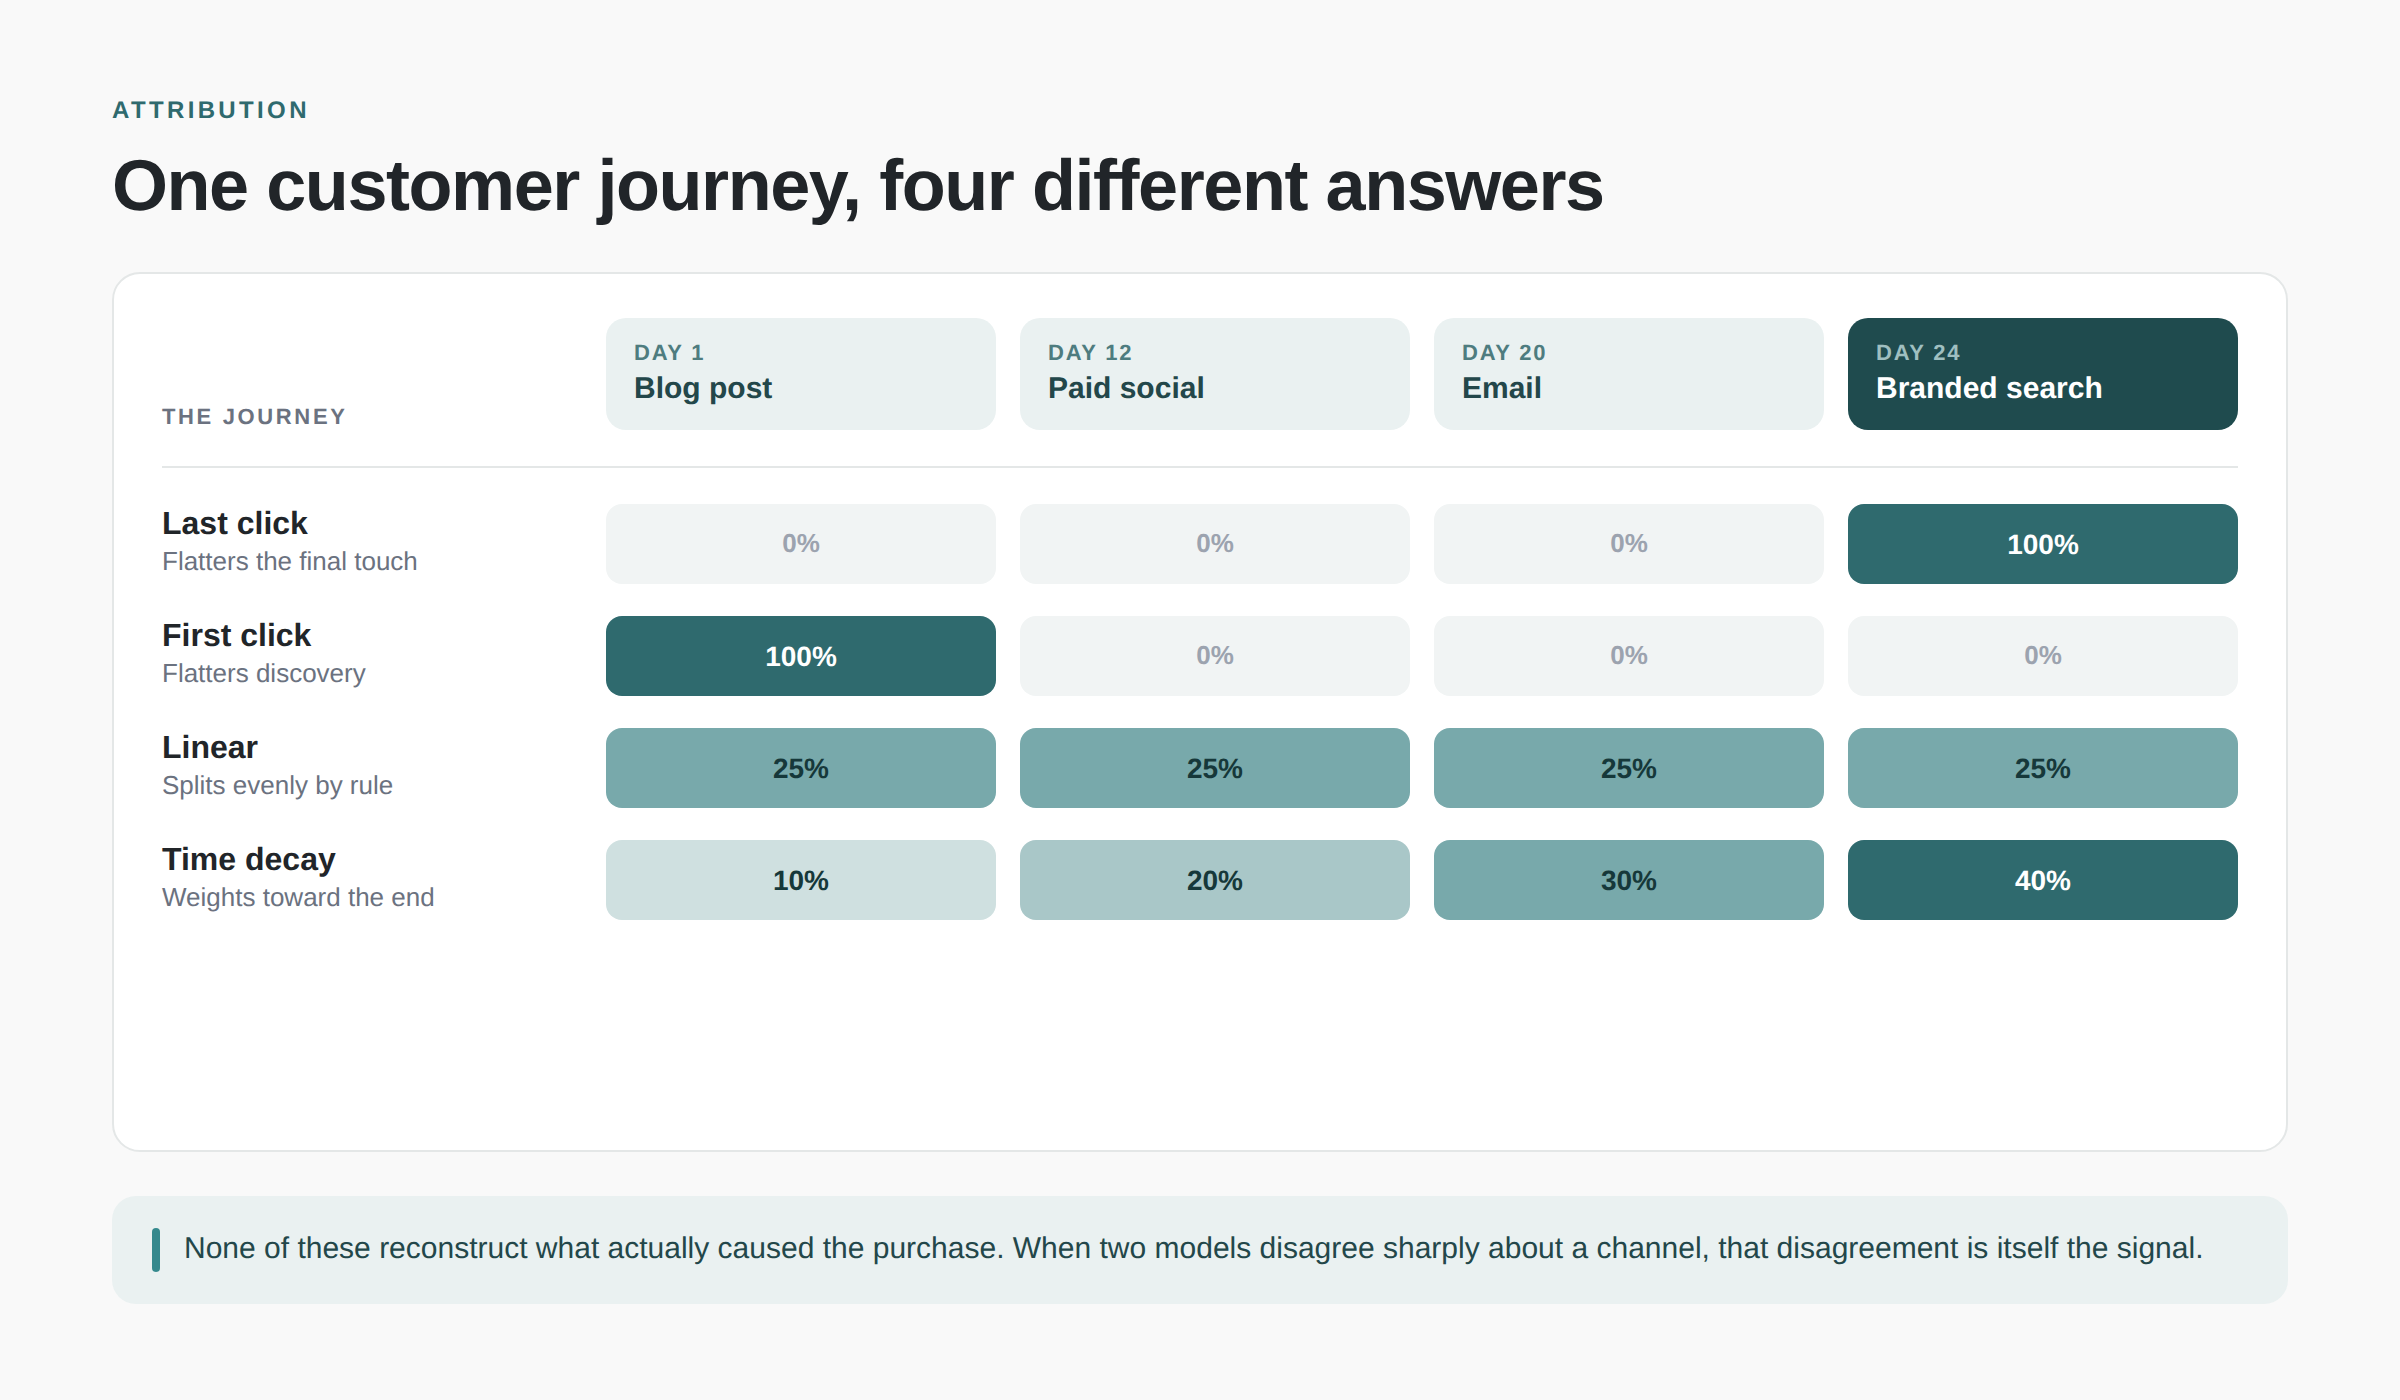
None of these models can perfectly reconstruct what caused someone to buy. The practical approach is to choose a model for consistent reporting, understand its bias, and avoid changing it whenever a different model produces a more flattering result.
Pay attention when models disagree sharply, too. If first-click attribution favors one channel while last-click attribution favors another, that disagreement can tell you something useful about the roles those channels play in the customer journey.
Attribution helps describe the journey, but it does not, by itself, prove causality.
5. Run simple incrementality tests when you can
You do not always need an expensive measurement vendor to learn whether marketing activity is contributing incremental results. Smaller teams can start with a few practical approaches.
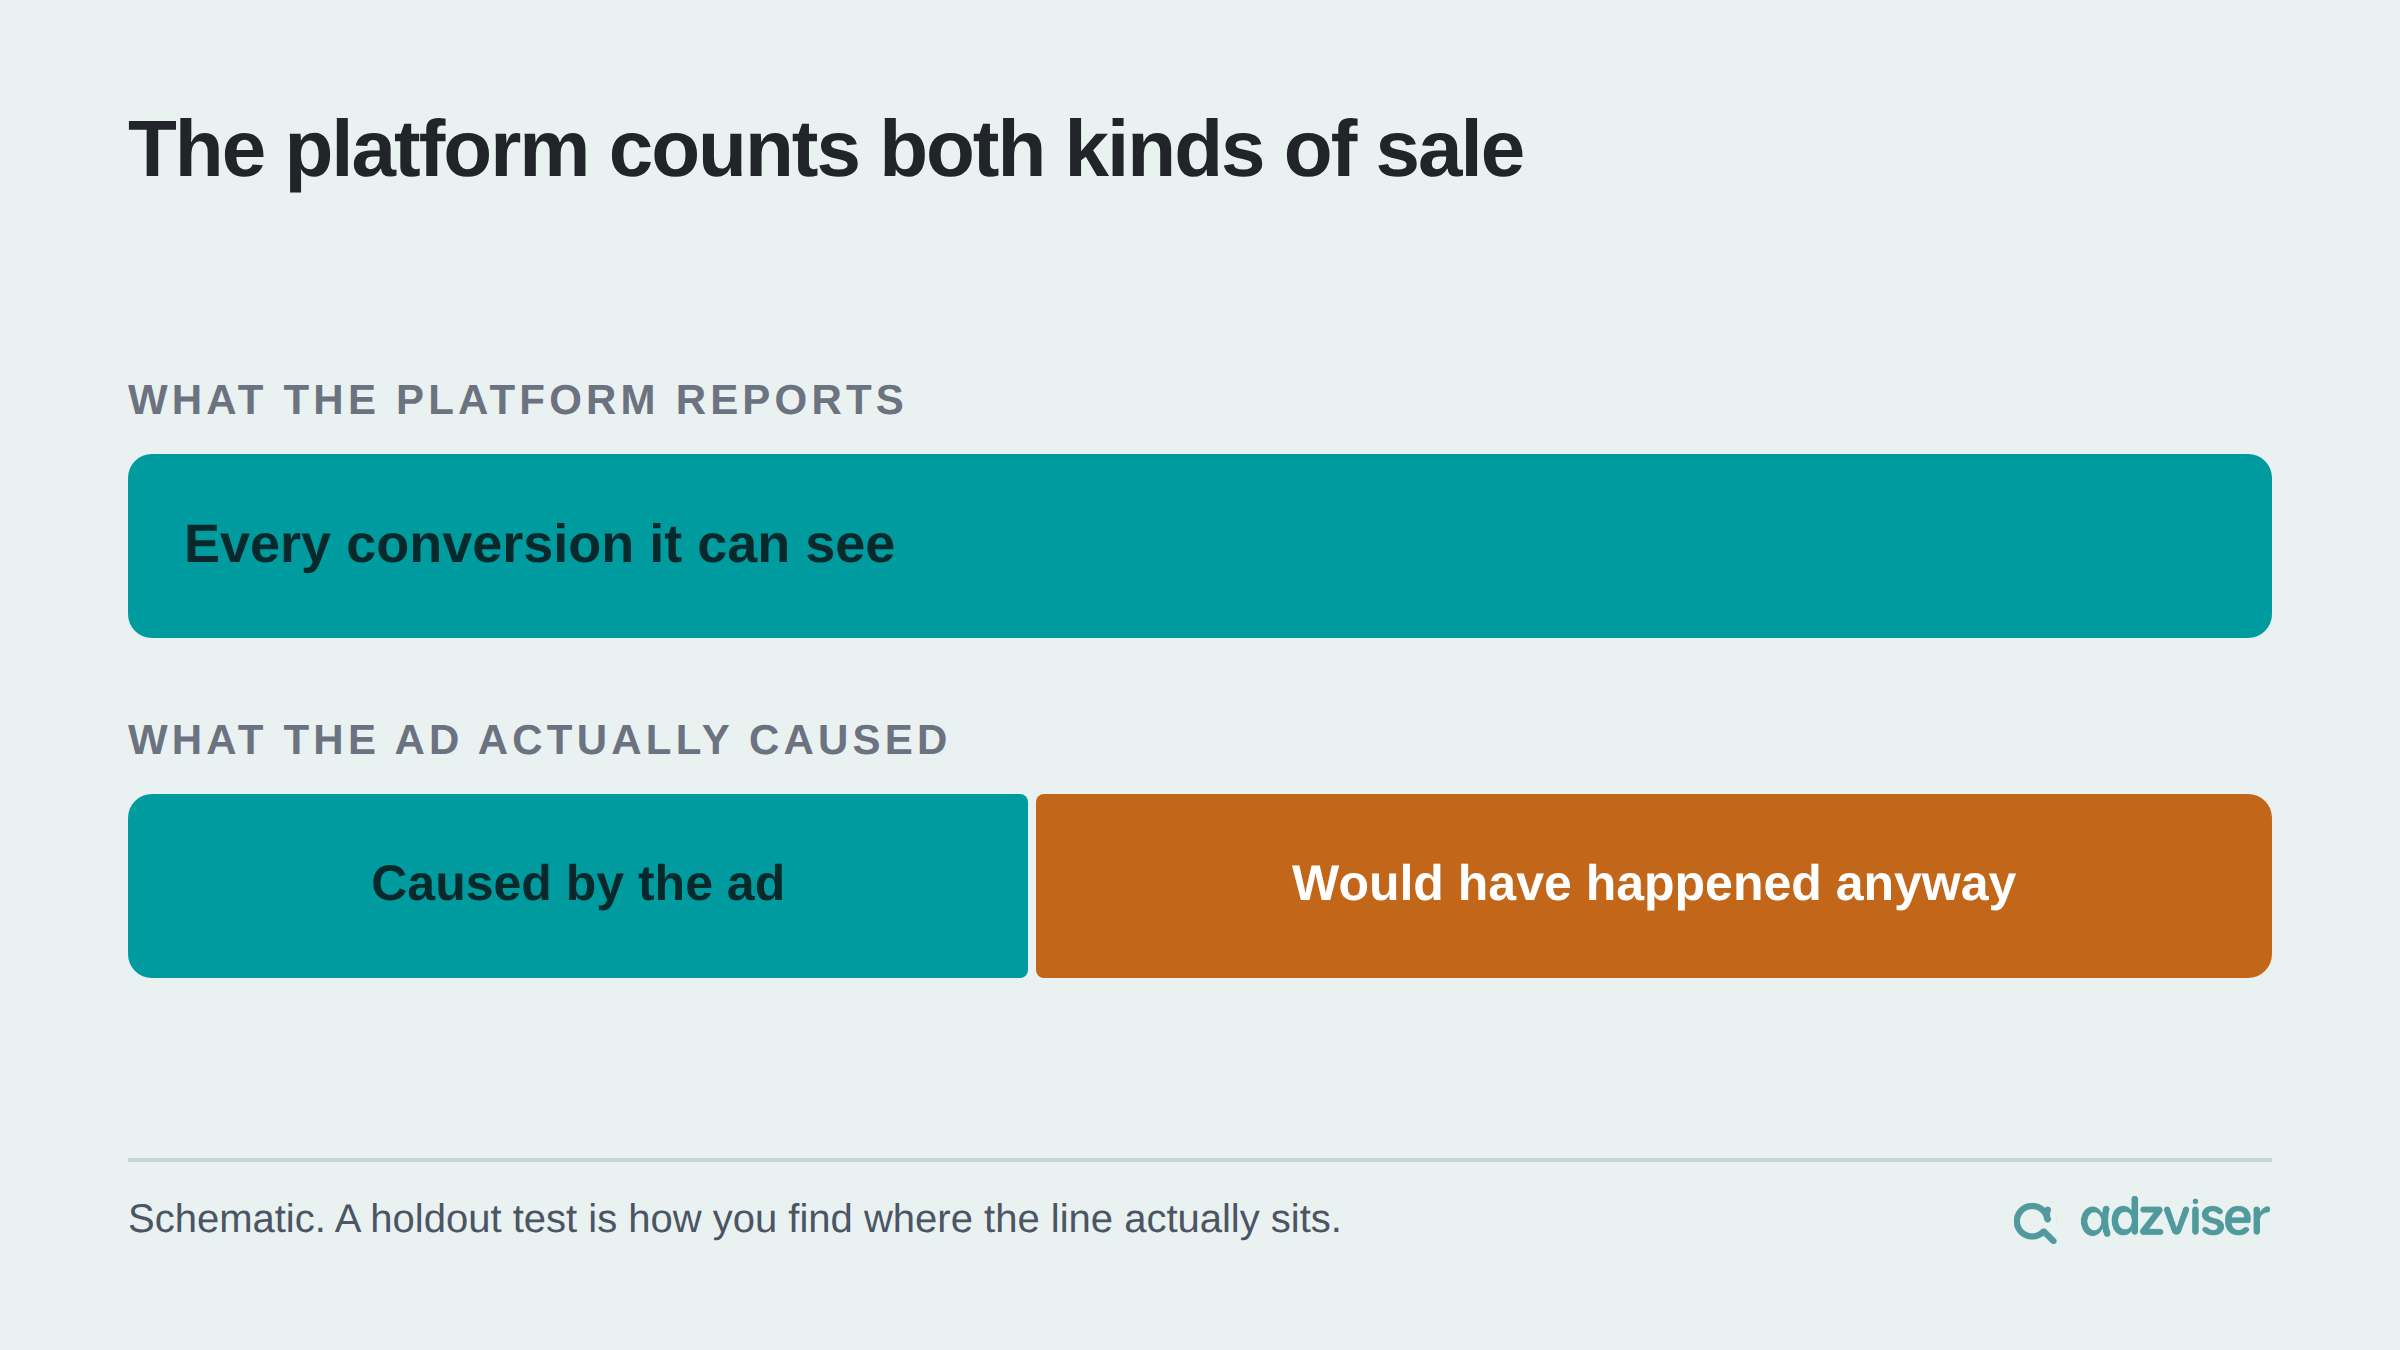
Pause or reduce spend. Reduce spend on a campaign, audience, or channel and compare what happens to your primary outcome. The test needs to be long enough to match the normal sales cycle and large enough to separate a real change from ordinary volatility.
Two weeks might be useful for a high-volume ecommerce business and almost meaningless for a B2B company with a three-month sales cycle. The point is not simply to turn campaigns off. It is to create a deliberate change and see whether the business outcome responds.
Use geographic holdouts. Run a campaign in a group of markets while keeping similar markets untreated, then compare the change in outcomes.
This can work well when demand is geographically distributed, but the regions need to be reasonably comparable. Seasonality, local promotions, spillover, and differences in baseline demand can distort the result.
Even an imperfect geo test can still be more informative than assuming every platform-attributed conversion was incremental.
Ask customers. Add an optional "How did you hear about us?" field at signup, checkout, or during the sales process.
Self-reported attribution has its own biases. People forget, simplify, or report the touchpoint they remember most. But that is also why it is useful: it can surface channels that digital tracking regularly misses, including podcasts, word of mouth, communities, newsletters, and content someone discovered months earlier.
You do not need to test everything at once. Even a few well-designed tests each year can challenge assumptions that otherwise live indefinitely inside your reports.
6. Set a cadence and stick to it
Measurement works better as a routine than as an emergency response:
- Weekly: Check pacing, spend, tracking problems, and anything obviously broken.
- Monthly: Review channel and campaign performance, investigate meaningful changes, and make budget decisions.
- Quarterly: Revisit channel mix, evaluate what you learned from experiments, and question whether your primary outcome is still the right one.
Checking performance constantly can feel productive, but daily fluctuations often contain more noise than useful information.
The review cadence should reflect how quickly your business actually generates meaningful data.
Content marketing measurement
Content deserves its own section because it behaves differently from paid acquisition.
A paid click and a purchase may happen in the same session. A blog post might be discovered in March, read again in June, and contribute to a purchase in September after the customer searches for your brand.
Last-click attribution might give the final conversion to search even though content played an important role earlier. That makes content marketing measurement harder.
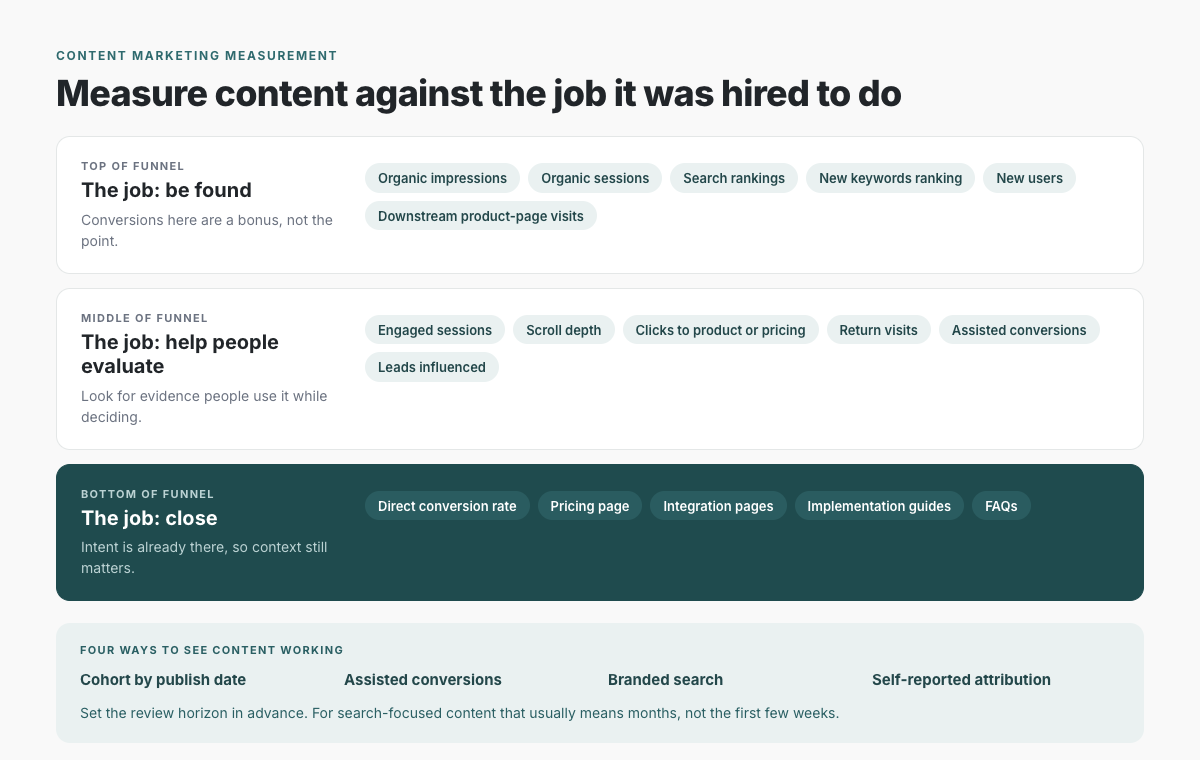
Instead of asking only, "How many conversions did this article generate?" ask what job the piece of content was created to do, then measure whether it is doing that job.
Top-of-funnel content
Top-of-funnel content usually exists to create discovery and attract the right audience.
Useful metrics may include:
- Organic impressions
- Organic sessions
- Search rankings
- New keywords ranking
- New users
- Downstream visits to product pages
Tools such as Google Search Console can help you track search impressions, clicks, queries, and landing-page performance over time.
Direct conversions can still matter, but they should not be the only way you judge a piece whose primary purpose is discovery.
Middle-of-funnel content
Comparison pages, case studies, educational resources, and product explainers often exist to help prospects evaluate a solution.
Look at metrics such as:
- Engaged sessions
- Scroll depth
- Clicks to product or pricing pages
- Return visits
- Assisted conversions
- Leads influenced
No single metric proves the content caused a purchase. You are looking for evidence that people use the content during evaluation.
Bottom-of-funnel content
Pricing pages, integration pages, product pages, implementation guides, and FAQs usually sit closer to a purchase decision.
Direct conversion rate becomes more useful here because visitors often arrive with stronger intent. But even at the bottom of the funnel, context matters. A page may appear to convert extremely well because the customer had already made most of the decision before arriving.
Four practical ways to measure content
Cohort content by publish date. Group articles by the month or quarter they were published and watch how their traffic develops over time.
Search-driven content often takes time to mature, so comparing a two-week-old article with one that has been indexed and ranking for a year tells you very little.
Cohorts let you see whether newer groups of content are developing faster or slower than older ones.
Watch assisted conversions. Look for journeys where a content page appeared before a conversion without receiving final-touch credit.
Assisted conversions are not perfect proof of causality, but they help identify content that appears repeatedly in successful customer journeys.
Monitor branded search. If awareness is growing, one possible signal is an increase in people searching directly for your company or product name.
Branded search is noisy. PR, offline activity, seasonality, partnerships, and many other things can affect it, so treat it as a supporting indicator rather than proof that a particular content campaign worked.
Use self-reported attribution. Ask customers where they first heard about you.
This can be especially useful for content because the first interaction may have happened weeks or months before the eventual conversion. The answer will not reconcile perfectly with your analytics data, and it does not need to.
It gives you another lens on a customer journey that digital tracking cannot completely observe.
Give content enough time
Content marketing measurement requires patience.
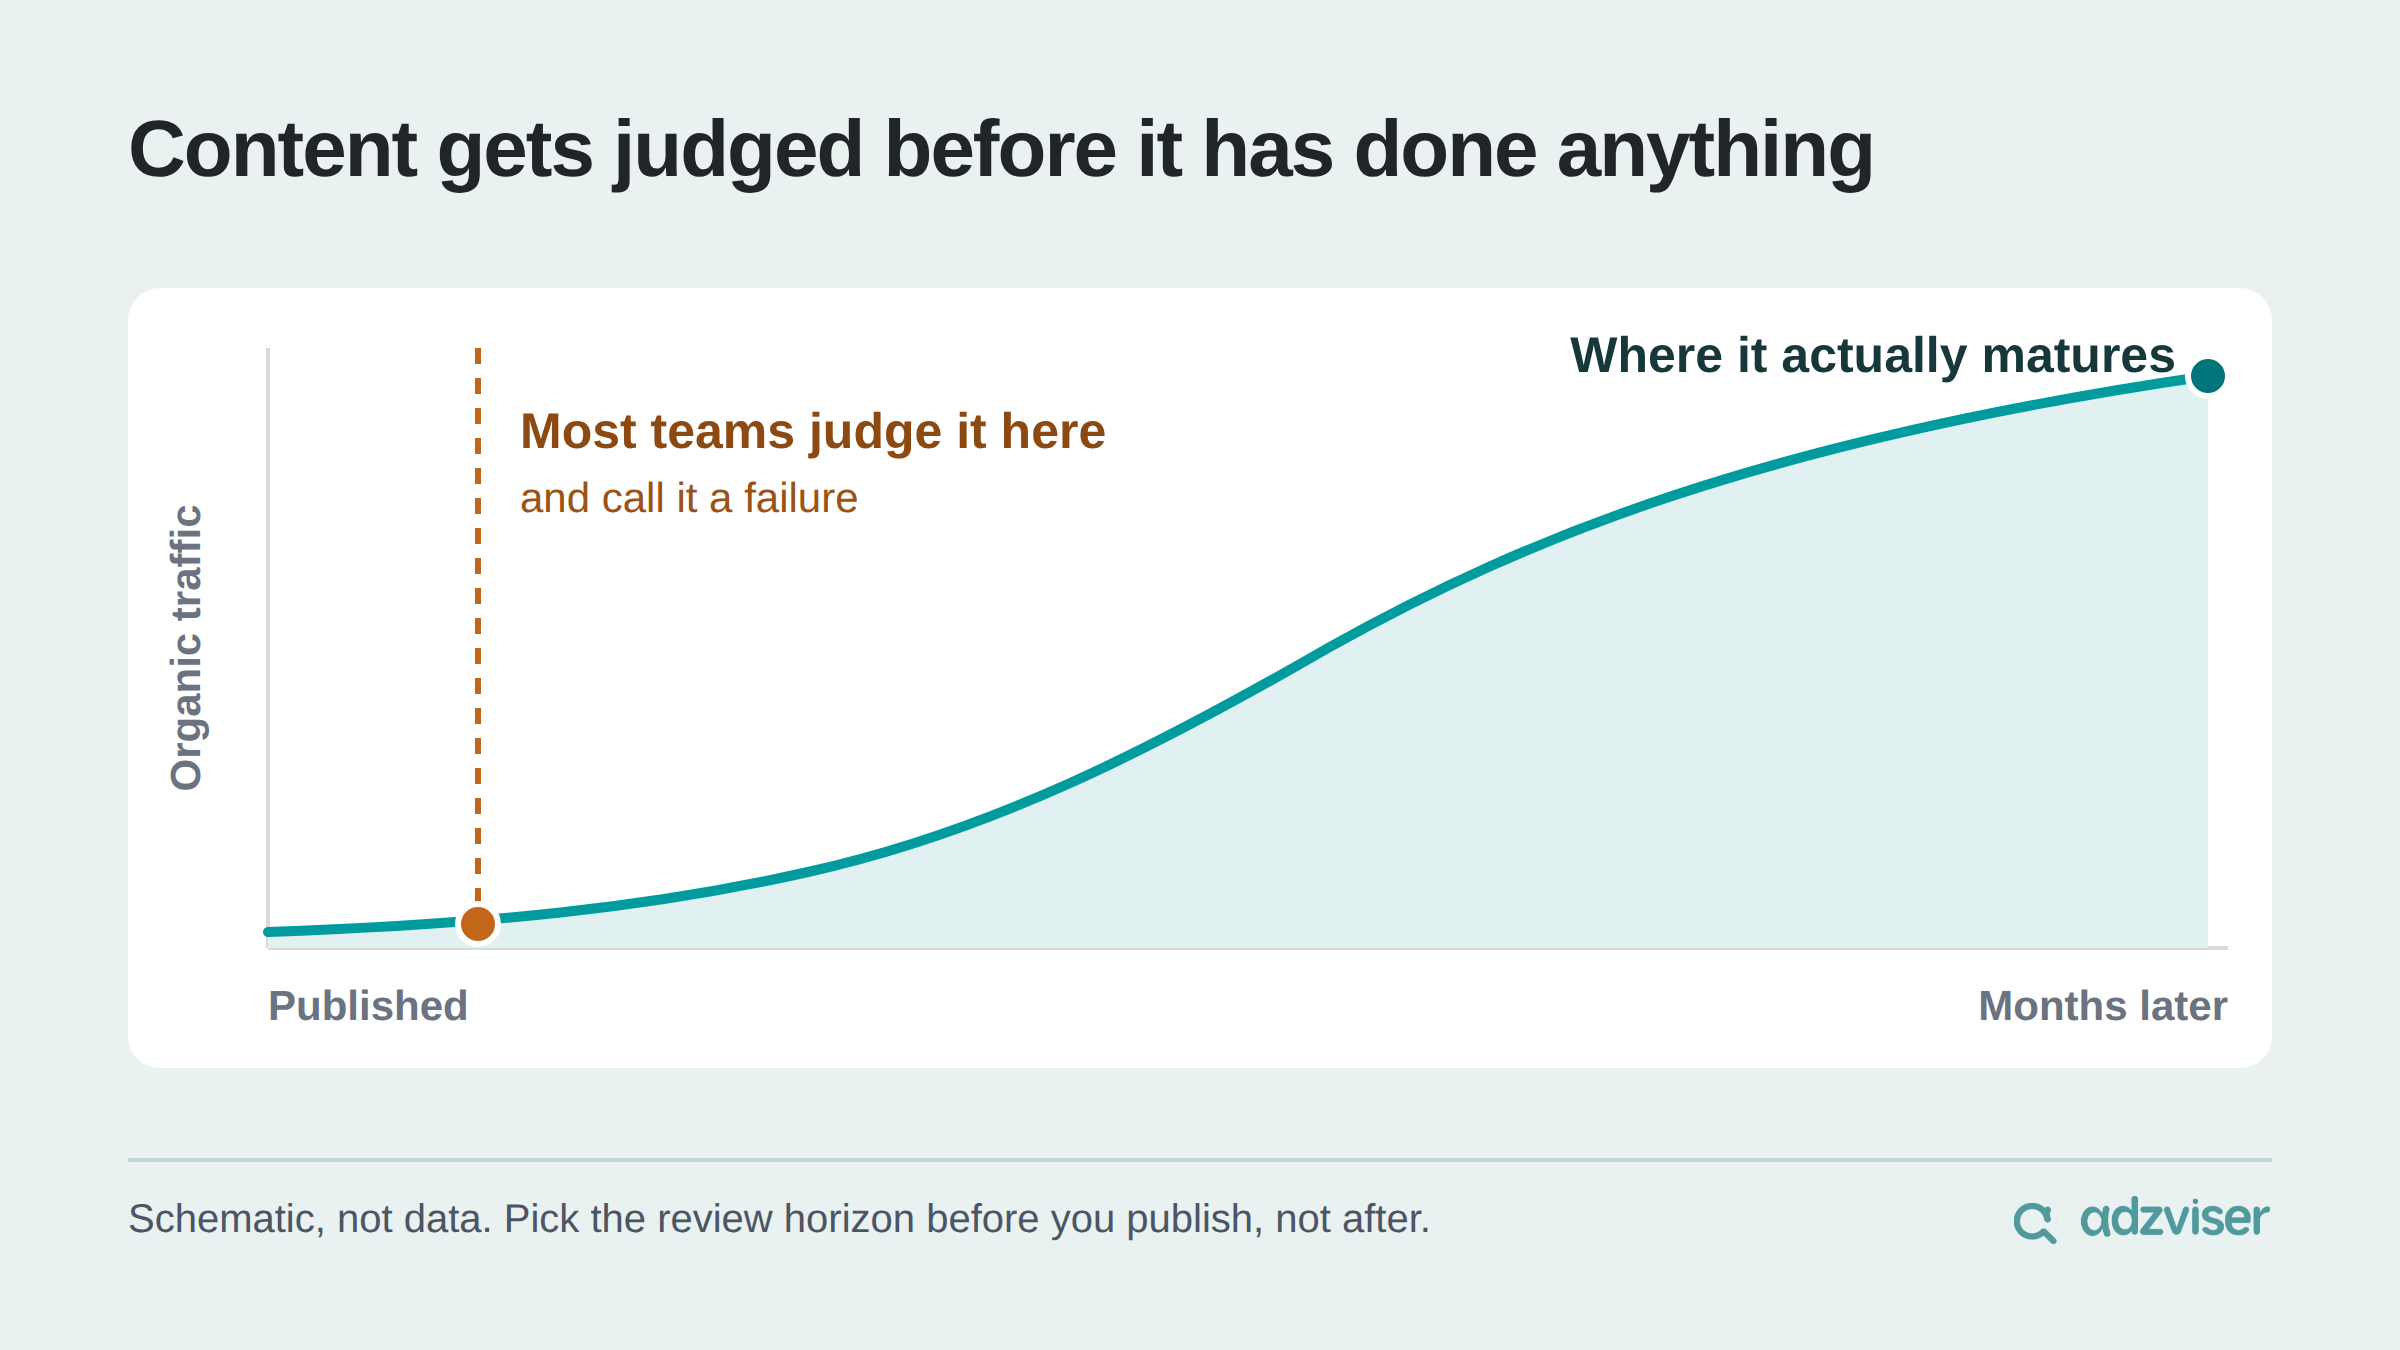
There is no universal point at which an article should start producing results. How quickly content performs depends on your site's existing authority, competition, search demand, distribution, topic, and the type of content you publish.
Instead of declaring a post successful or unsuccessful after a few weeks, choose a review horizon in advance. For search-focused content, that often means reviewing performance over several months rather than reacting to the first month's traffic.
Metrics that matter and metrics that waste your time
The most useful metrics are usually the ones closest to business decisions.
Depending on your business, that might include:
- Cost per acquisition by channel
- Customer acquisition cost
- Customer lifetime value
- CAC payback period
- Conversion rate by funnel stage
- Qualified leads
- New-customer revenue
- Organic traffic growth
- Pipeline influenced
- Incremental lift from experiments
Other metrics need more context. Impressions alone rarely tell you much about business performance. Raw follower counts can look impressive without producing meaningful demand. Email open rates have become less reliable as a measure of human engagement because privacy features can affect how opens are recorded. Bounce rate can mean completely different things depending on the page and the visitor's intent.
A useful test is simple: Has this metric ever changed what we did next?
If nobody uses a number to diagnose a problem, make a decision, or test an assumption, ask why it is taking up space in the report.
Four mistakes that cost teams the most
Measuring everything
A report with 60 metrics is rarely six times as useful as one with 10.
Start with the business outcome and work backward. Every metric should have a reason to be there.
Comparing platform numbers as if they should match
Meta Ads, Google Ads, LinkedIn Ads, GA4, your CRM, and an ecommerce platform such as Shopify can all report different conversion totals.
That does not automatically mean one of them is broken. They may use different attribution windows, identity methods, conversion definitions, or rules for view-through and cross-device activity.
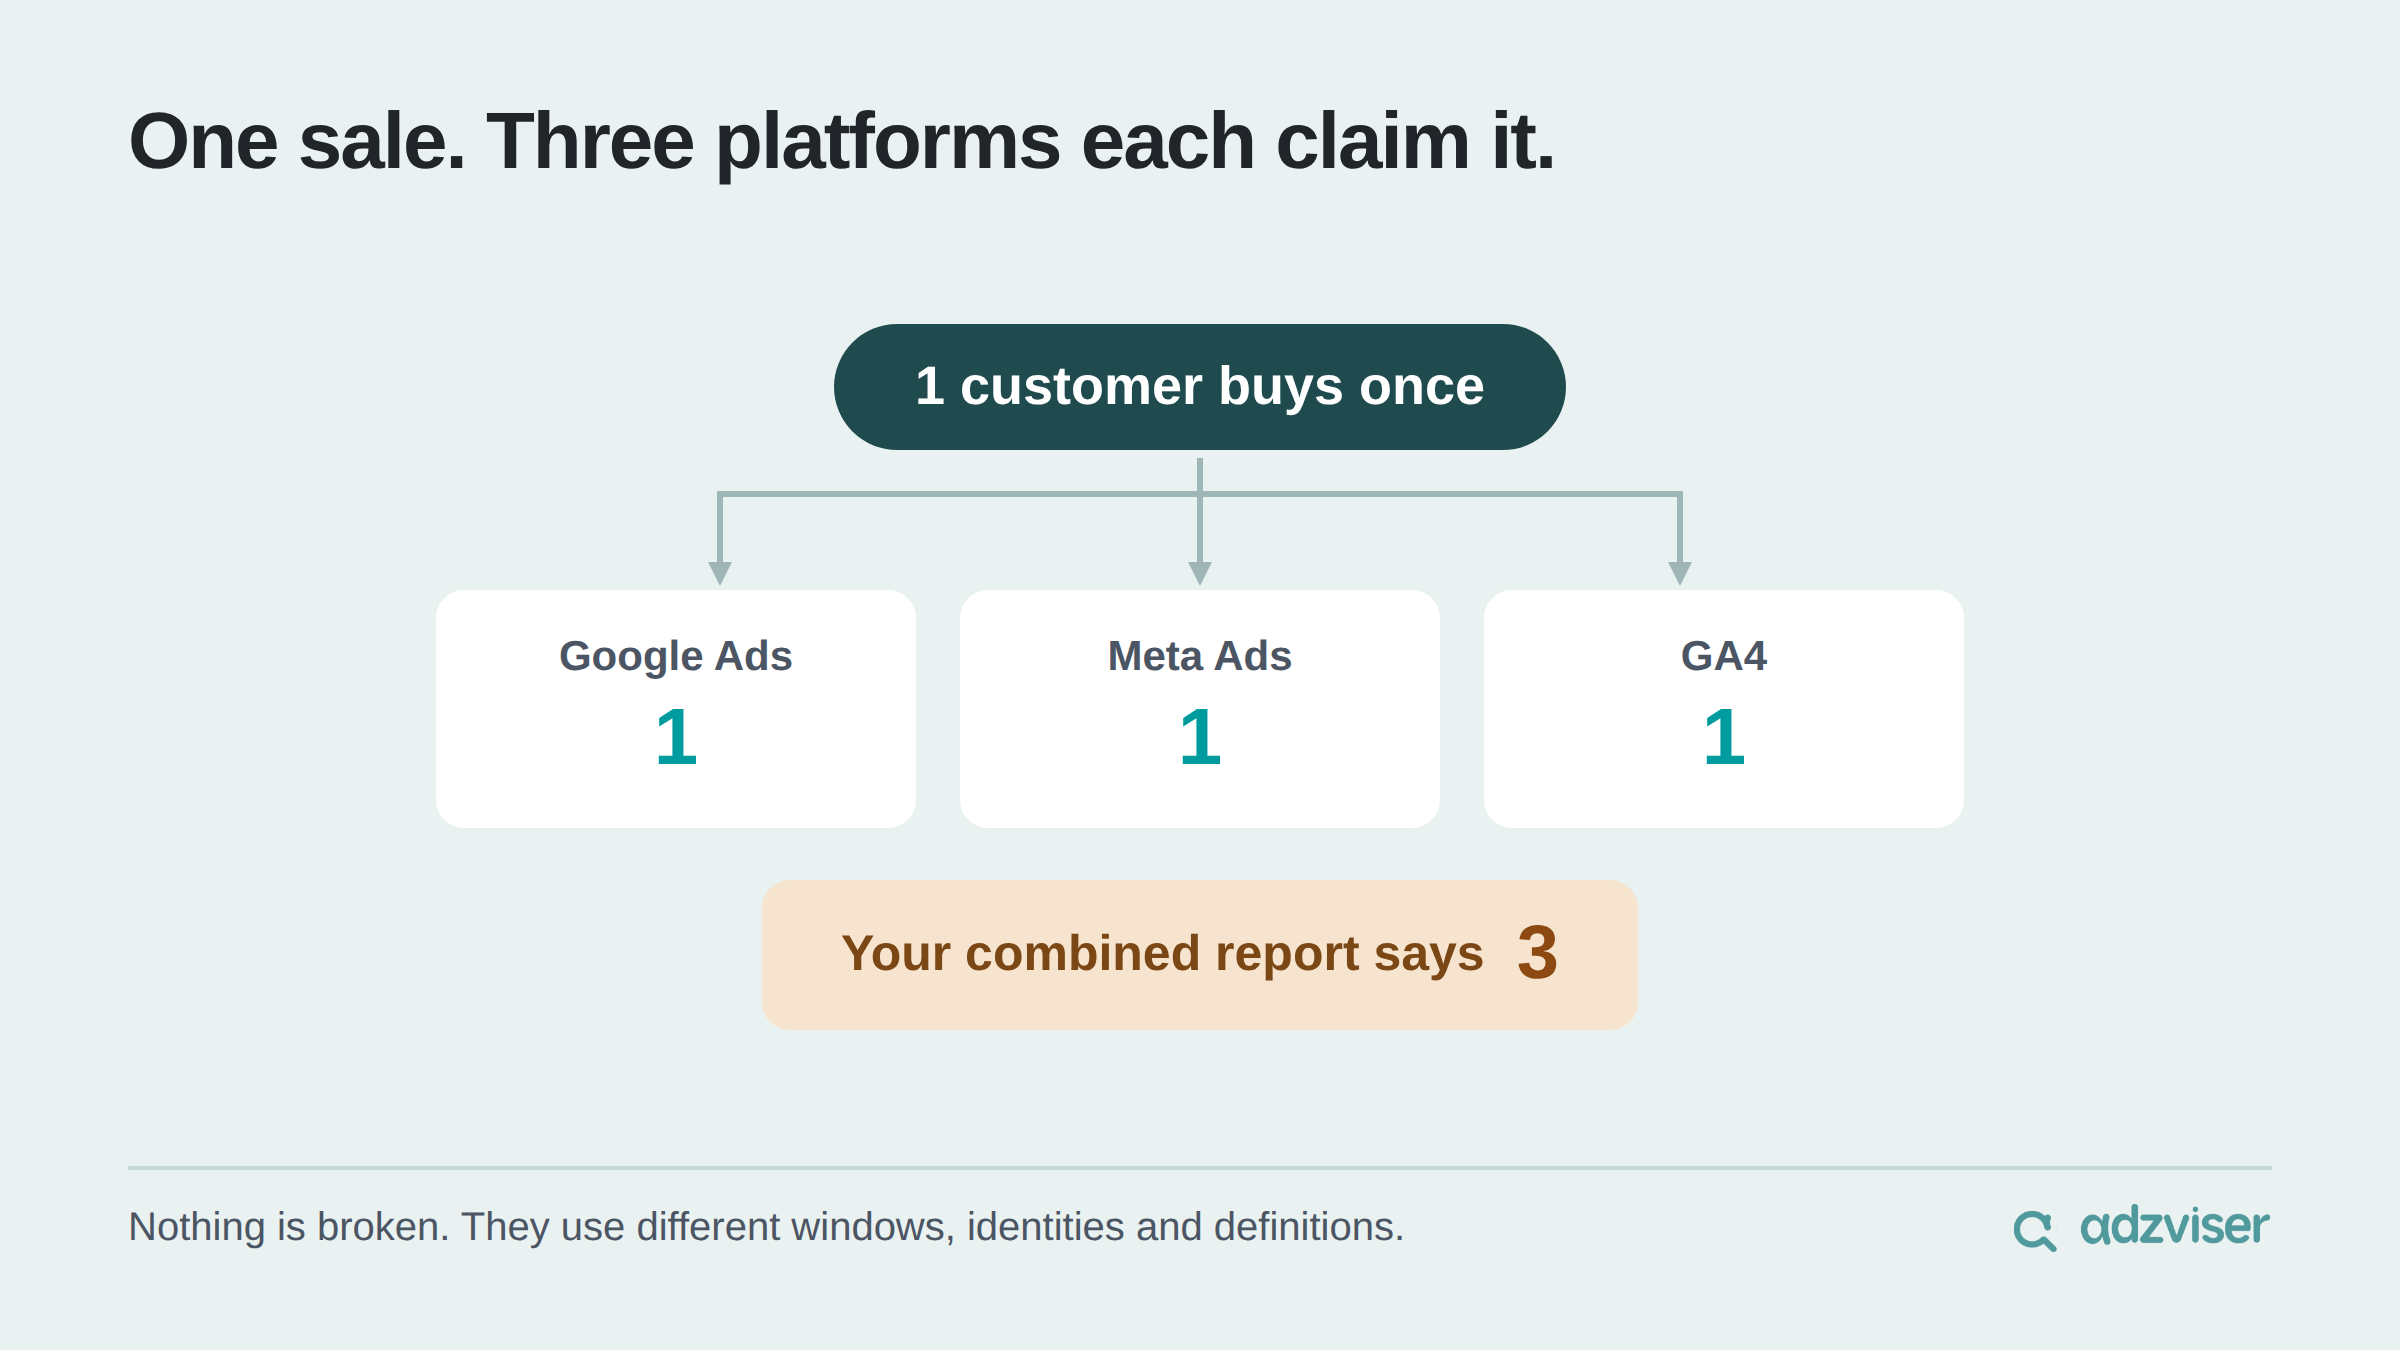
Choose an appropriate source of record for business outcomes and use platform metrics primarily to understand and optimize activity within those platforms.
Changing attribution whenever the answer looks bad
Changing attribution models mid-quarter can make trends difficult to interpret.
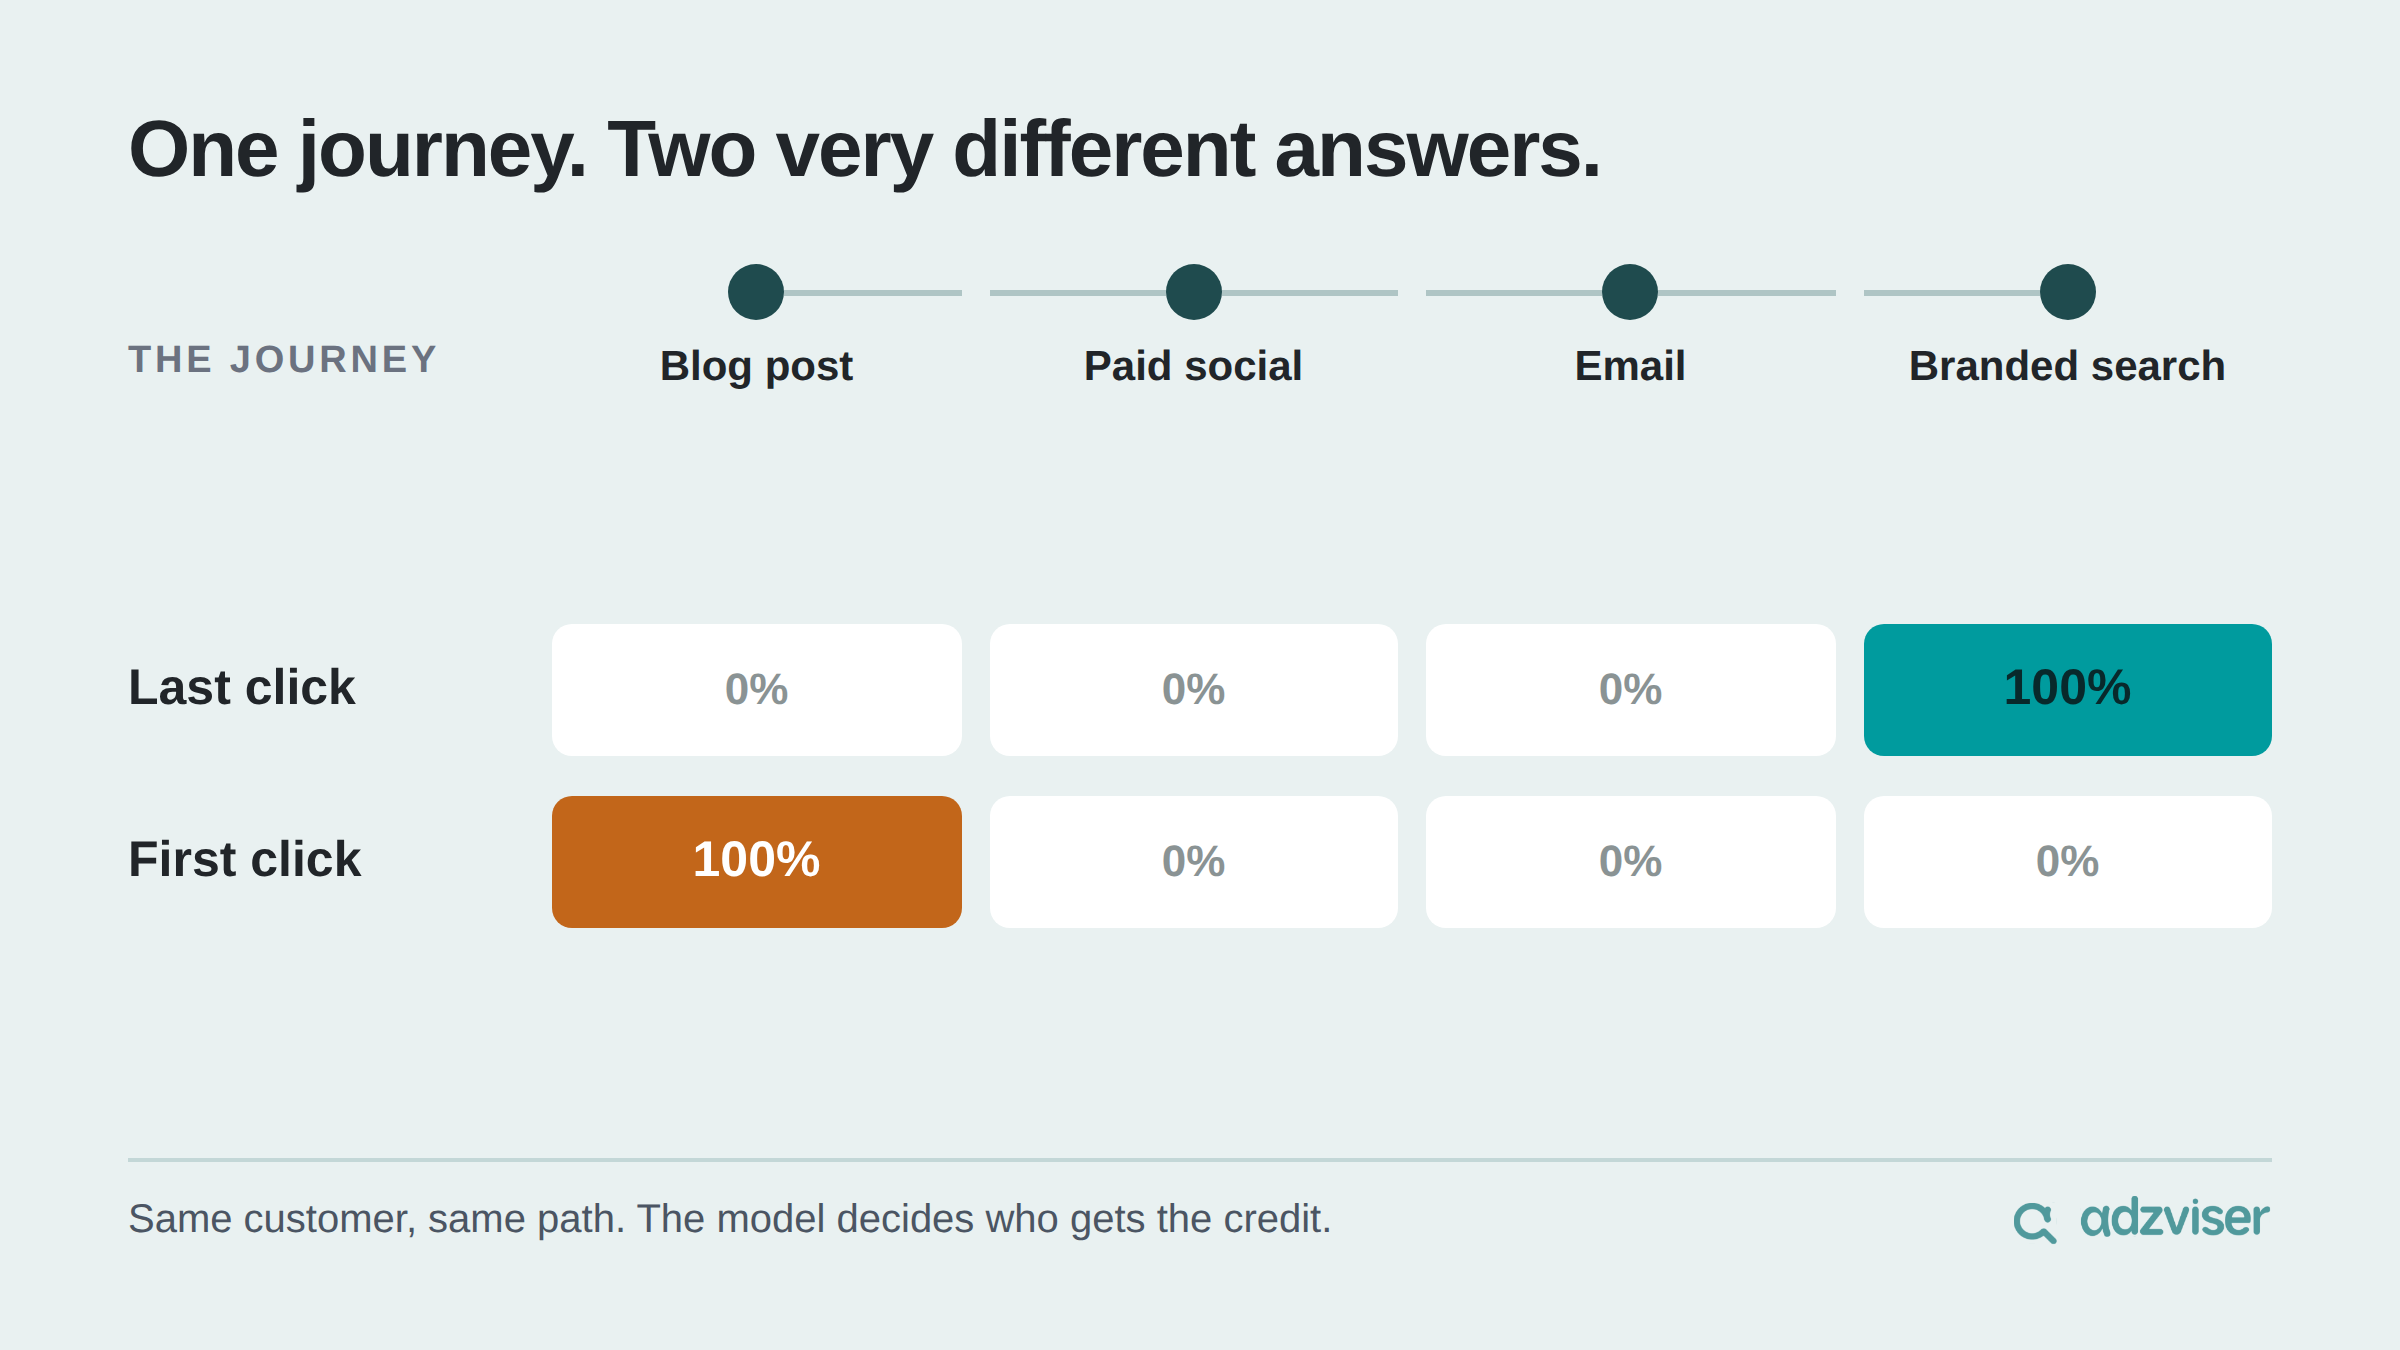
Document the model you use for regular reporting and keep it stable enough that month-to-month comparisons remain meaningful. You can still compare other attribution models; just do not quietly replace the ruler every time you measure.
Confusing correlation with contribution
Sales increased while ads were running, so the ads caused the increase. Maybe. But sales can also change because of seasonality, pricing, promotions, product changes, press coverage, competitors, economic conditions, or dozens of other factors.
A dashboard can show that two things happened at the same time. Measurement tries to determine how much one contributed to the other.
That is why experiments, holdouts, multiple attribution lenses, and customer feedback matter.
Putting it together without a data team
A practical marketing measurement setup for a small team does not need to be complicated. You need:
- One primary business outcome with a clear definition
- Consistent tracking and UTMs
- A small set of useful metrics and breakdowns
- A consistent attribution approach for reporting
- A monthly decision-making cadence
- Occasional tests that challenge what the dashboards are telling you
- A longer measurement horizon for content
Then you need the data in one place.
That infrastructure piece is often the annoying part. Your advertising data is in one platform, analytics in another, ecommerce somewhere else, and CRM data in another system entirely. Exporting CSVs from every platform each month is also how otherwise good measurement processes gradually disappear.
If you do not want to build your reporting from scratch, Adzviser also offers marketing report templates, including dedicated marketing analytics templates.
That is the gap Adzviser fills.
Adzviser connects marketing, ecommerce, CRM, and analytics data sources and brings their metrics and breakdowns into the destinations where you already work.
That could mean pulling your reporting into Google Sheets, building dashboards in Looker Studio or Power BI, working with the data in Microsoft Excel, or analyzing your marketing data in ChatGPT.
The software handles the reporting layer. Your job is to ask the more important questions:
- What happened?
- Why did it happen?
- What should we change?
That is where marketing reporting turns into marketing measurement.
Marketing measurement FAQs
Marketing analytics helps explain what happened and identify patterns in the data. Marketing measurement goes a step further by asking how much marketing contributed to the result and what decisions should follow from that evidence. The two overlap, but measurement puts more emphasis on causality and decision-making.
Start with one clearly defined business outcome. Make sure your basic tracking is reliable, monitor a small number of useful metrics, review performance on a consistent schedule, and use simple tests when possible to challenge your attribution assumptions. You do not need an enterprise measurement stack to start making better decisions.
There is no universal timeline. Results depend on factors such as your existing audience, domain authority, competition, distribution, search demand, and the type of content you publish. For search-focused content, evaluate performance over months rather than making a decision based only on the first few weeks.
There is no single attribution model that is correct for every business. Choose a model that fits your reporting needs, understand what it tends to over- or under-credit, and keep it consistent enough to compare performance over time. Then supplement attribution with other evidence such as self-reported attribution and controlled tests when possible.
A useful starting point is weekly for pacing and obvious problems, monthly for channel and budget decisions, and quarterly for broader strategy and measurement assumptions. The right cadence depends on your sales cycle and how quickly your business generates enough data to make meaningful decisions.
Hi! I am Zeyuan Gu. I am building easy-to-use and affordable data connectors for marketers. You can read about my journey and what I have learned along the way on this blog.