Ecommerce Reporting: How to Stop Rebuilding the Same Report
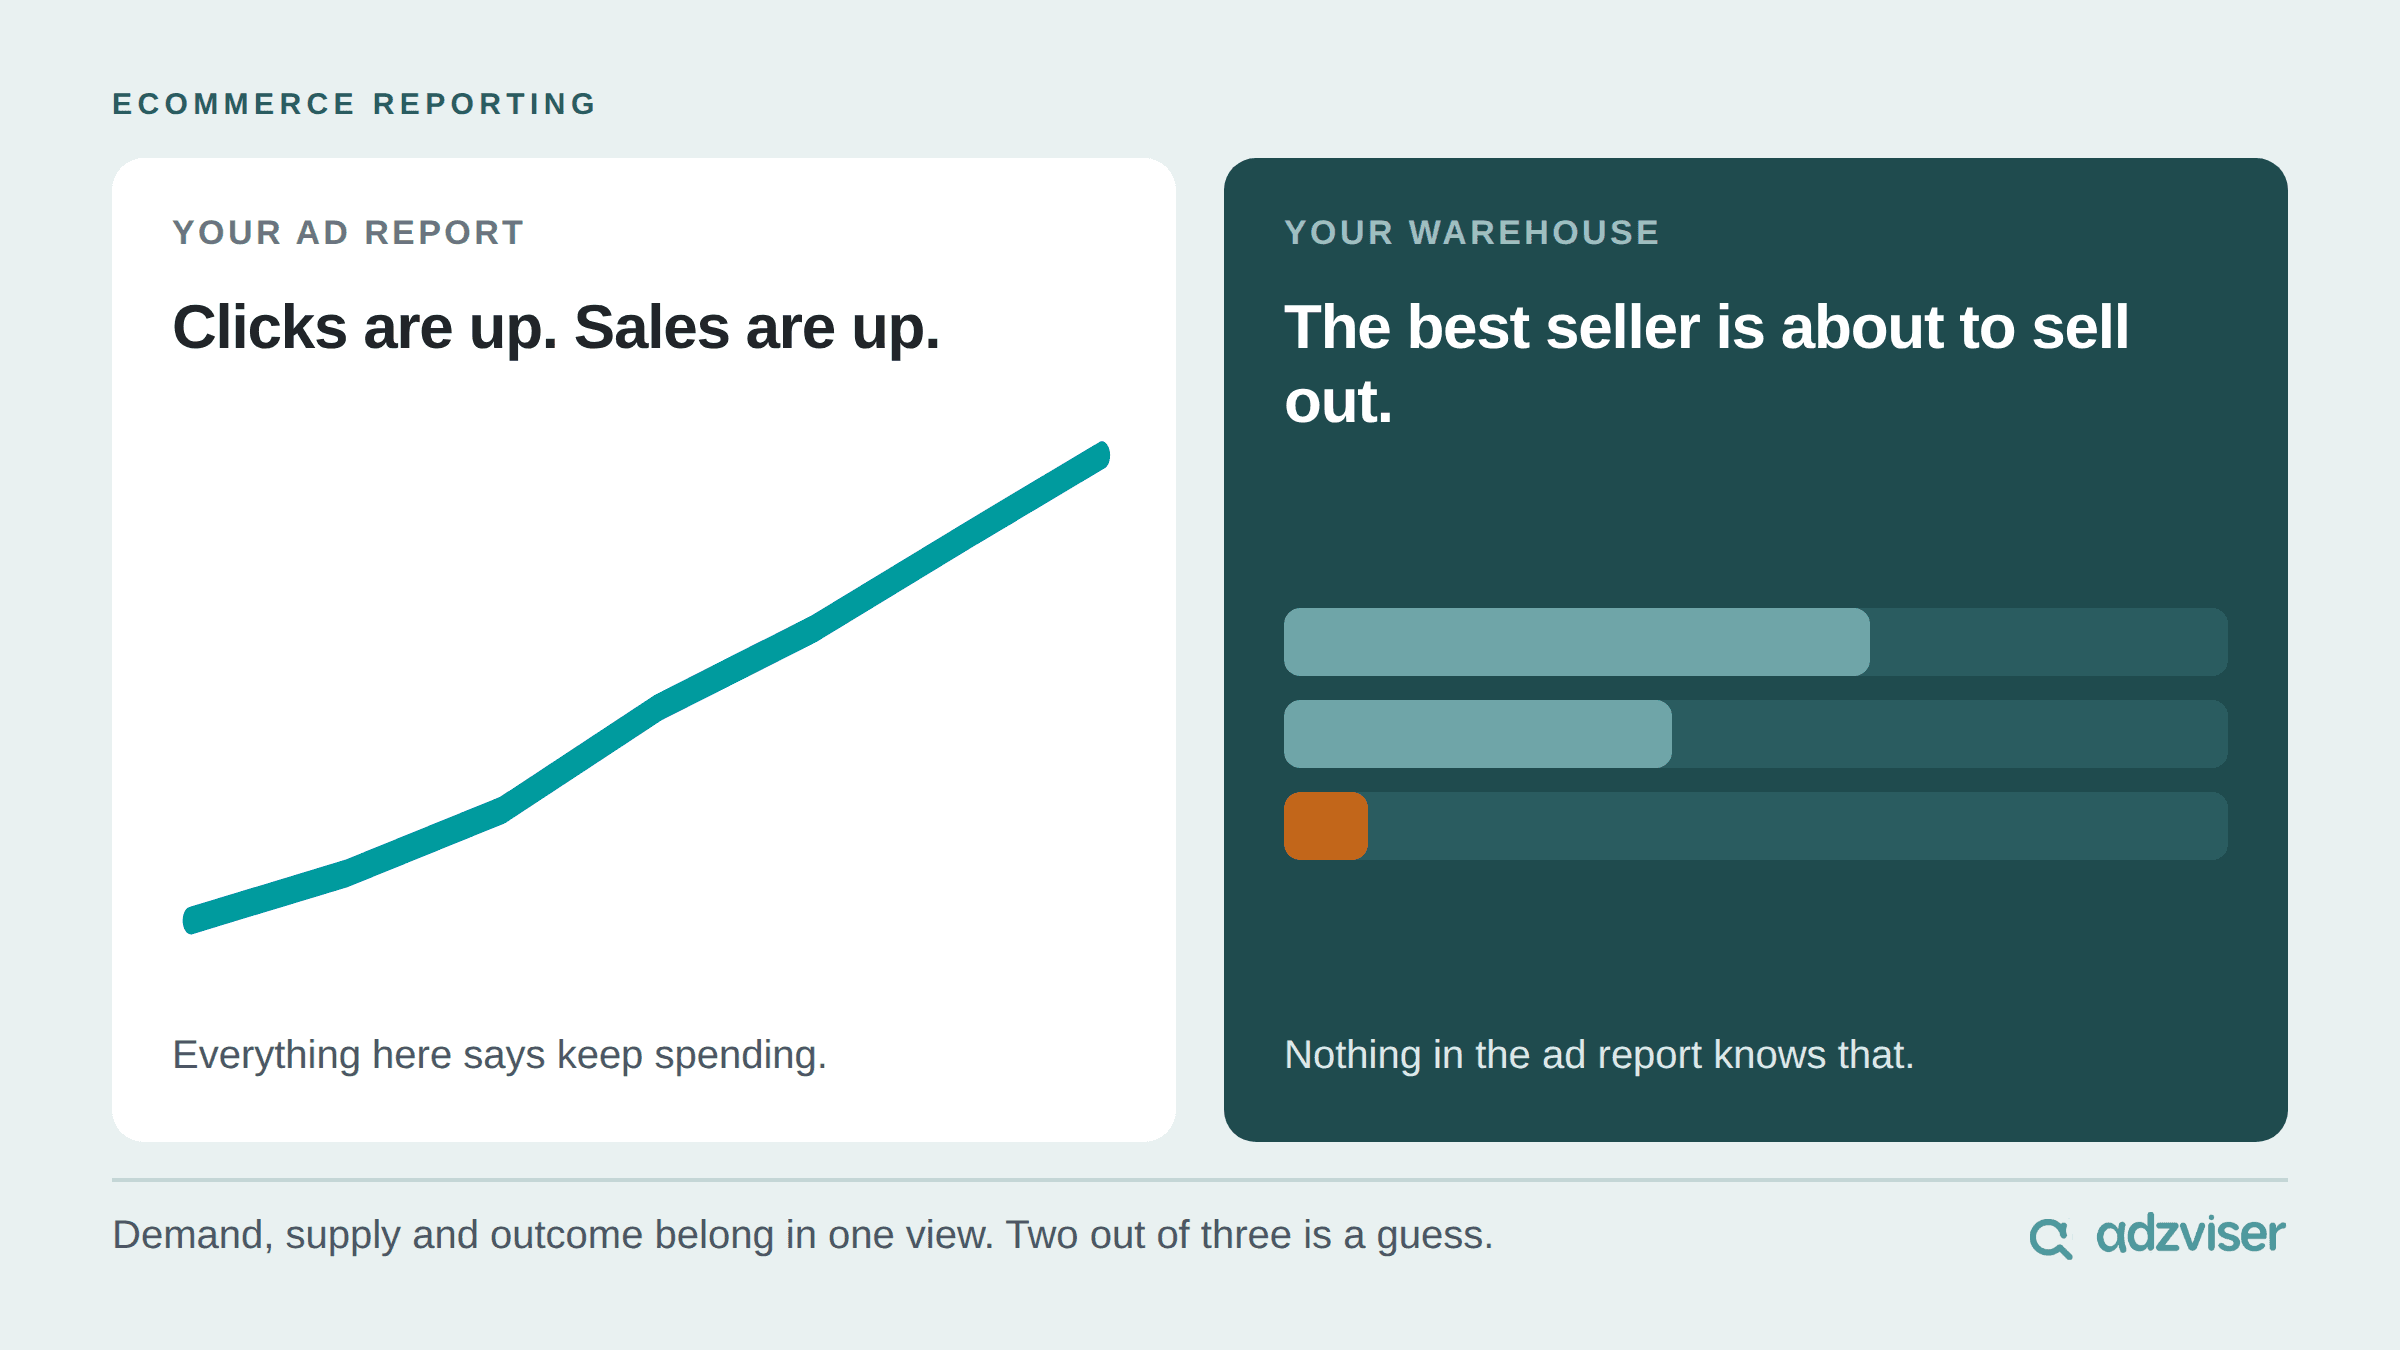
If you run ecommerce reporting, you've probably rebuilt some version of the same report more times than you'd like to admit.
The numbers are rarely the hard part. They already exist, sitting in your storefront, your marketplace account, and your ad platform. The work is bringing them together in a shape you trust, without losing a morning to it every time.
That's what ecommerce reporting is for. Done well, it gives you one view you can open on a Monday and act on the same day.
Below are three ready-made templates you can connect to your own data today. After those, the rest of this guide covers the metrics worth tracking, the problems that make reporting harder than it should be, and how to structure a report people will actually read.
Three ecommerce report templates you can connect today
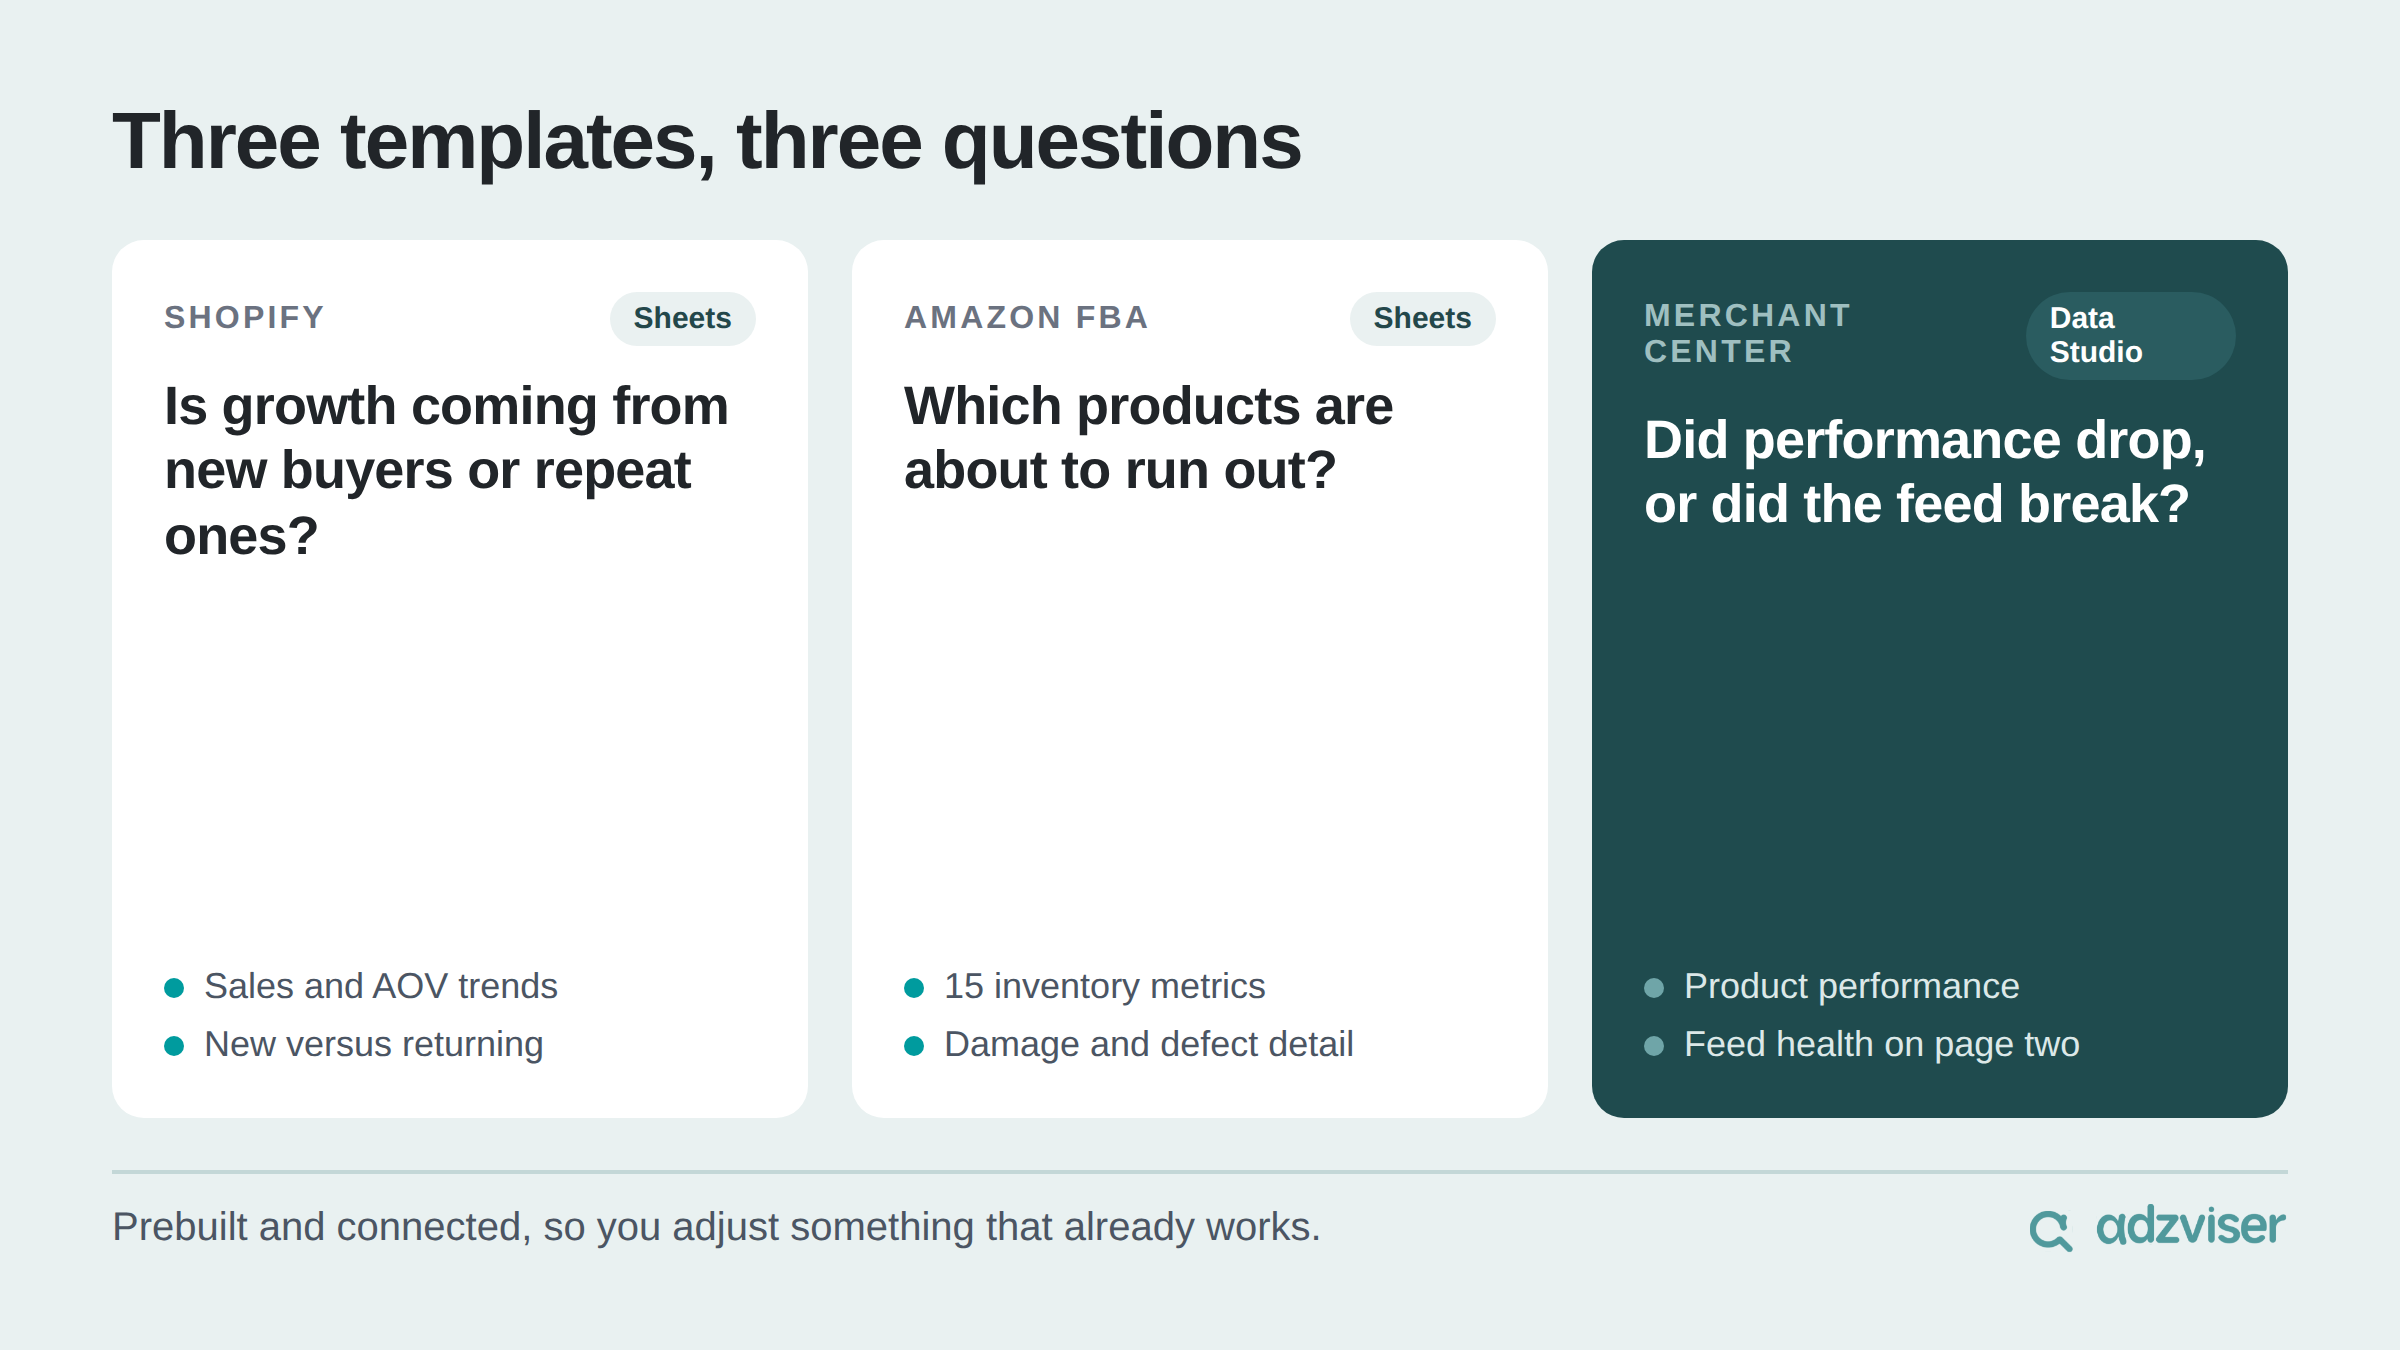
Each of these is built around a question store operators ask constantly. They're prebuilt, so instead of starting from a blank sheet you're adjusting something that already works.
1. Shopify Orders & Sales report template
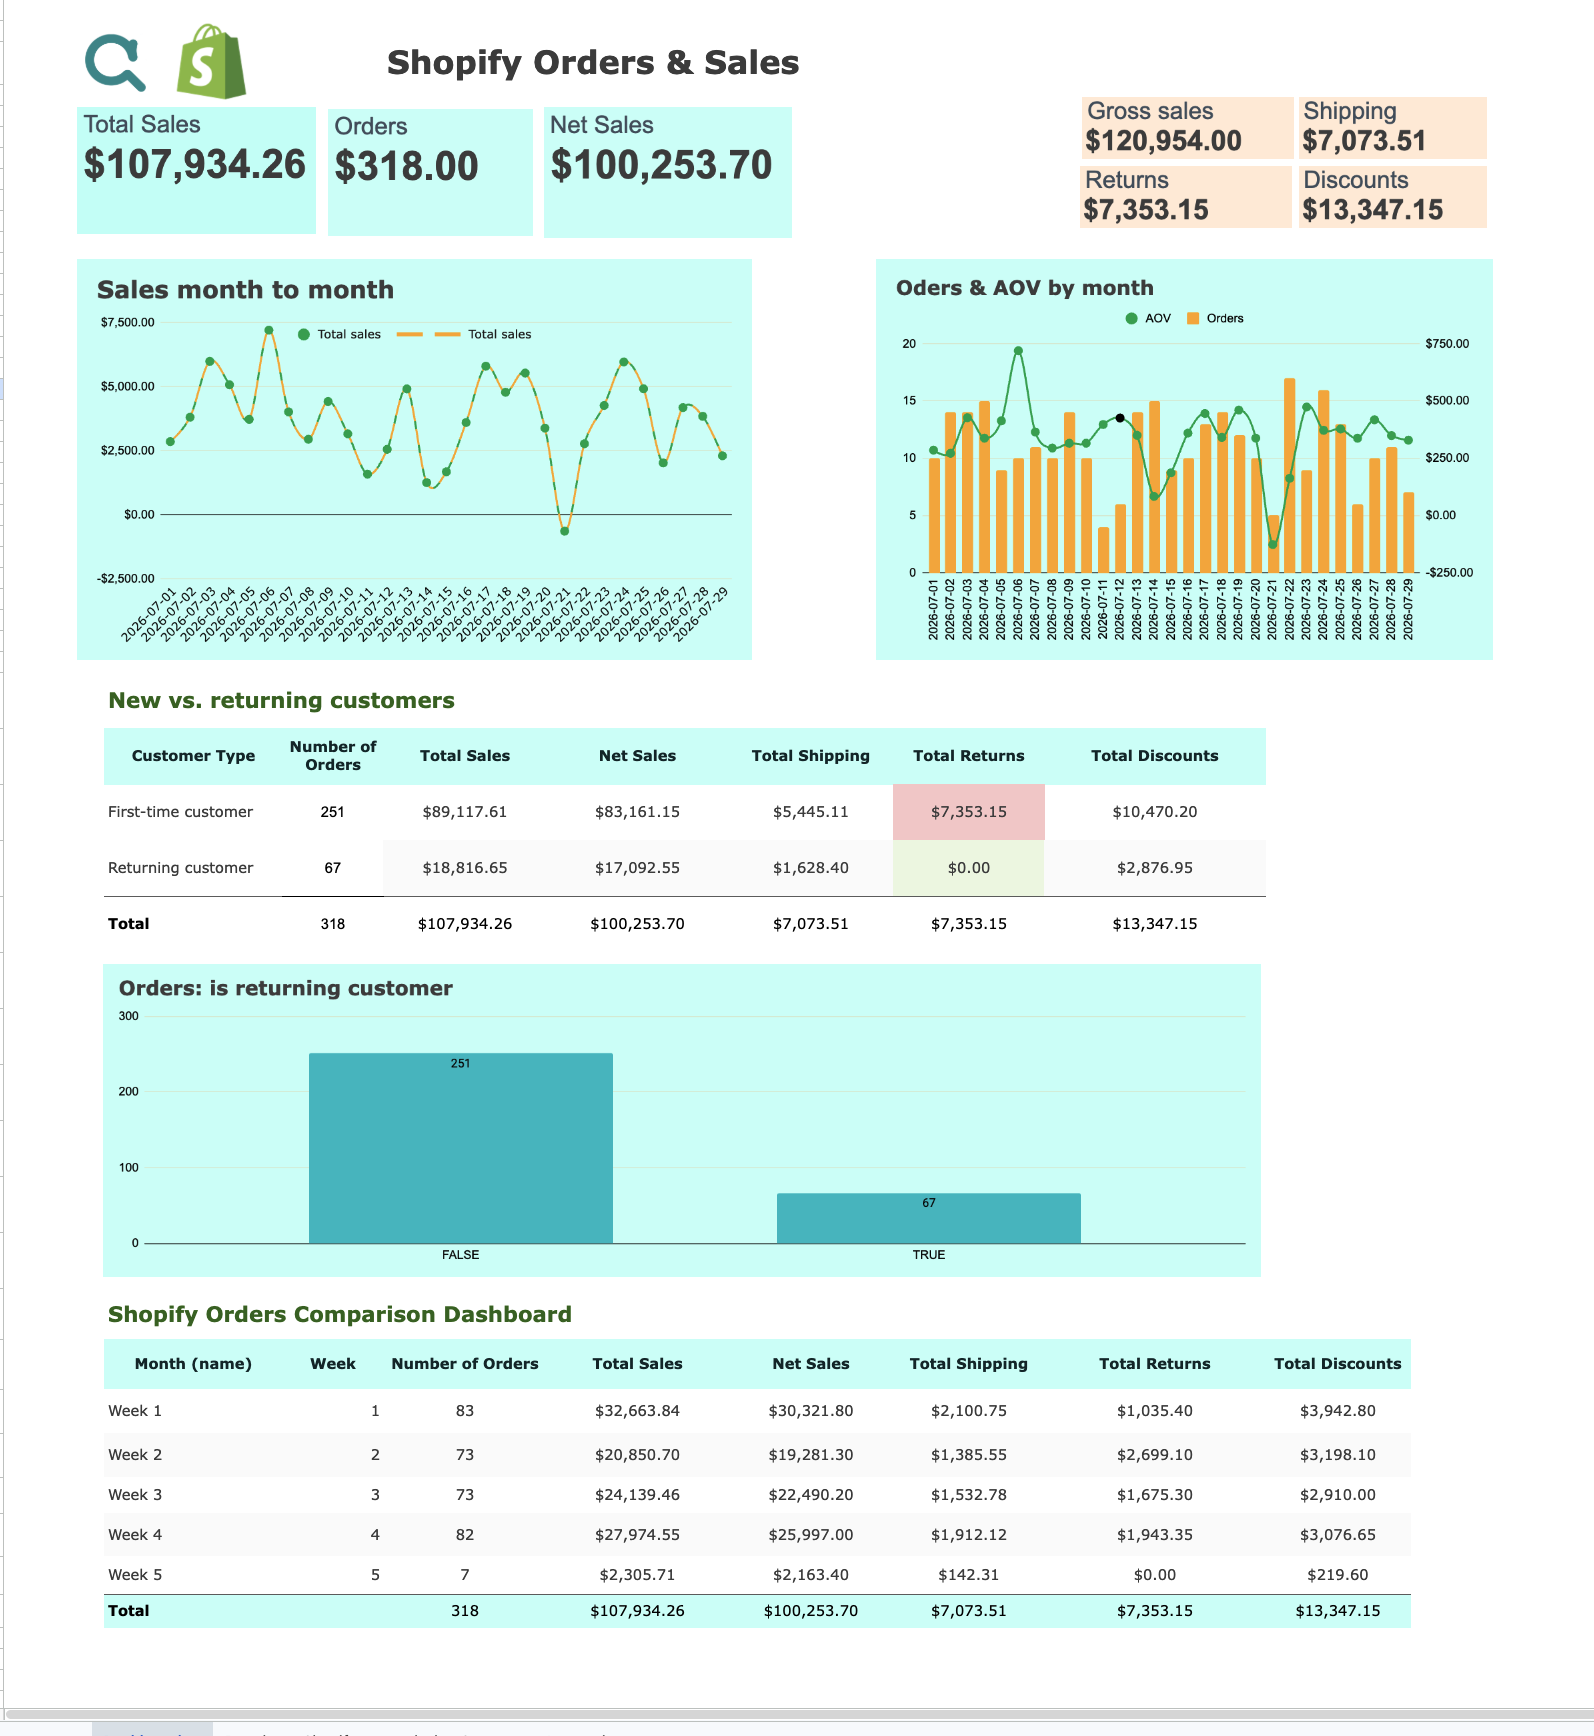
A Google Sheets template that pulls your live Shopify data for clear ecommerce performance analytics, no formulas required.
- Metrics: total sales, gross sales, net sales, orders, average order value, shipping, returns, discounts
- Breakdowns: order created datetime, month, week, order name, confirmation status, and new versus returning customers
- Includes: sales and orders/AOV trend charts, a new versus returning customer breakdown, and a weekly orders comparison table
- Answers: how sales are trending, and whether growth is coming from new buyers or repeat ones
If you're on WooCommerce rather than Shopify, both storefronts are supported.
Get the Shopify Orders & Sales template →
2. Amazon Seller Central Inventory (FBA) report template
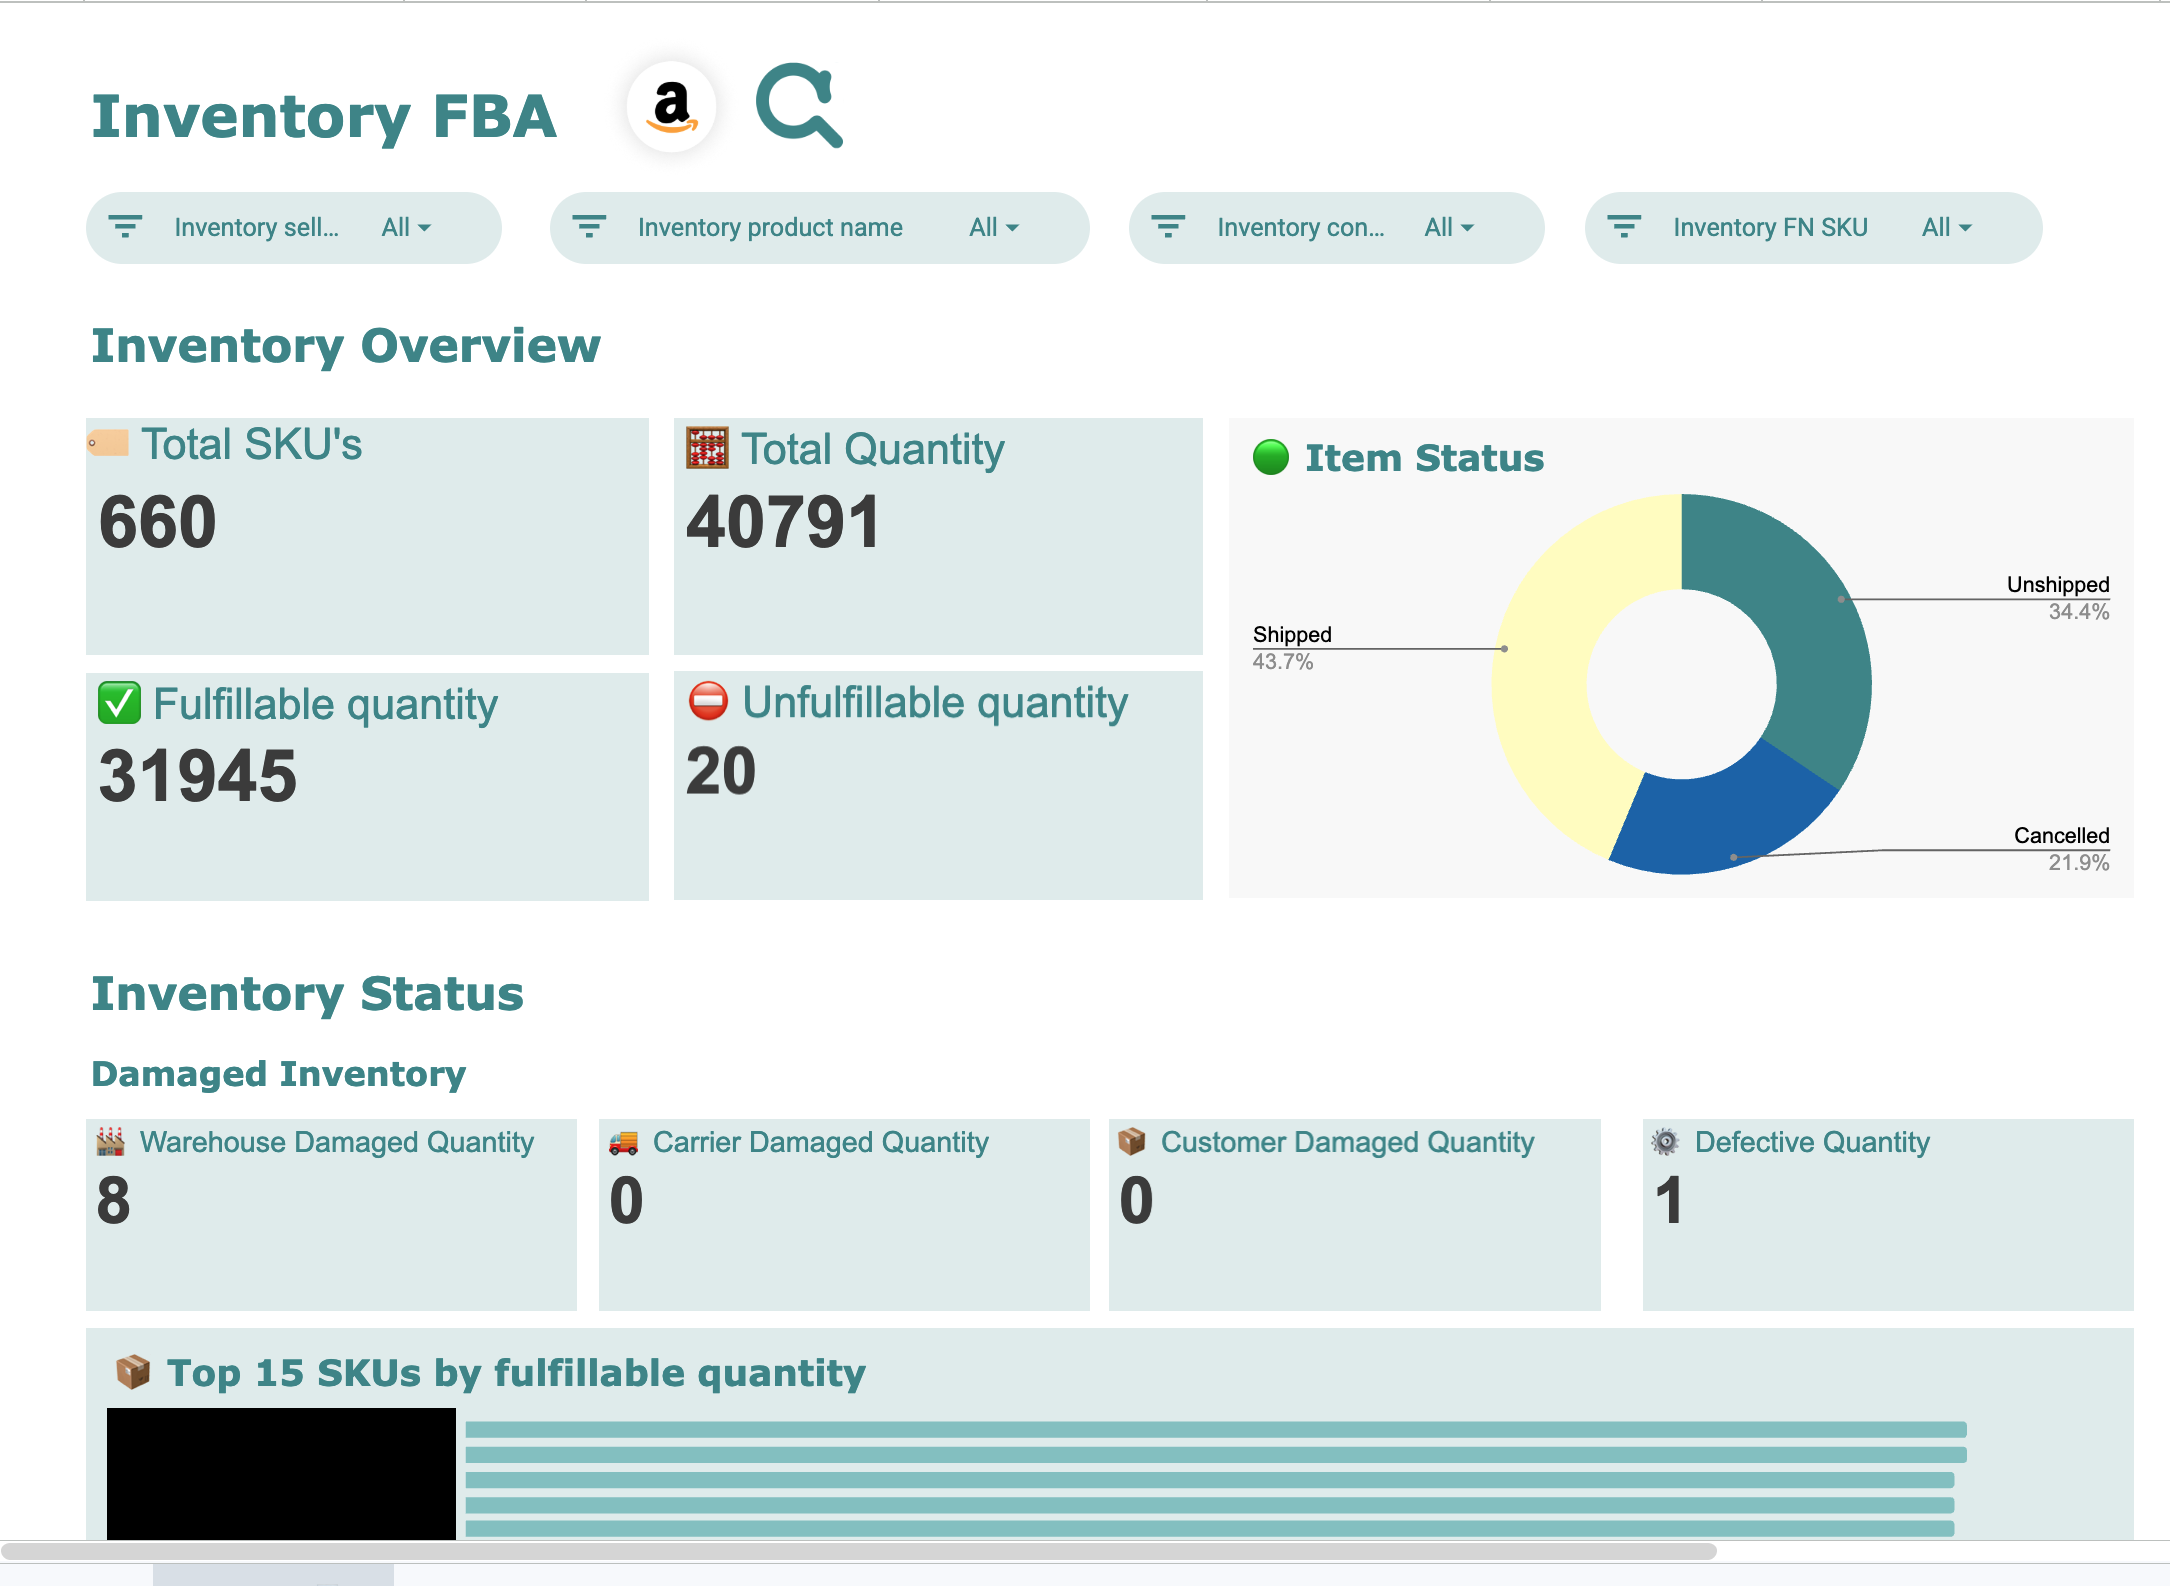
A Google Sheets template that catches Amazon stock problems before they turn into lost sales.
- Metrics: 15 in all, covering total SKUs and quantity, fulfillable and unfulfillable quantity, damage and defect detail (warehouse, carrier, customer damaged, defective), researching quantity, reserved quantity with pending customer orders and transshipments, and the three inbound stages (working, shipped, receiving)
- Breakdowns: inventory seller SKU, product name, inventory condition, FN SKU, item status
- Answers: which products are at risk of running out of stock right now
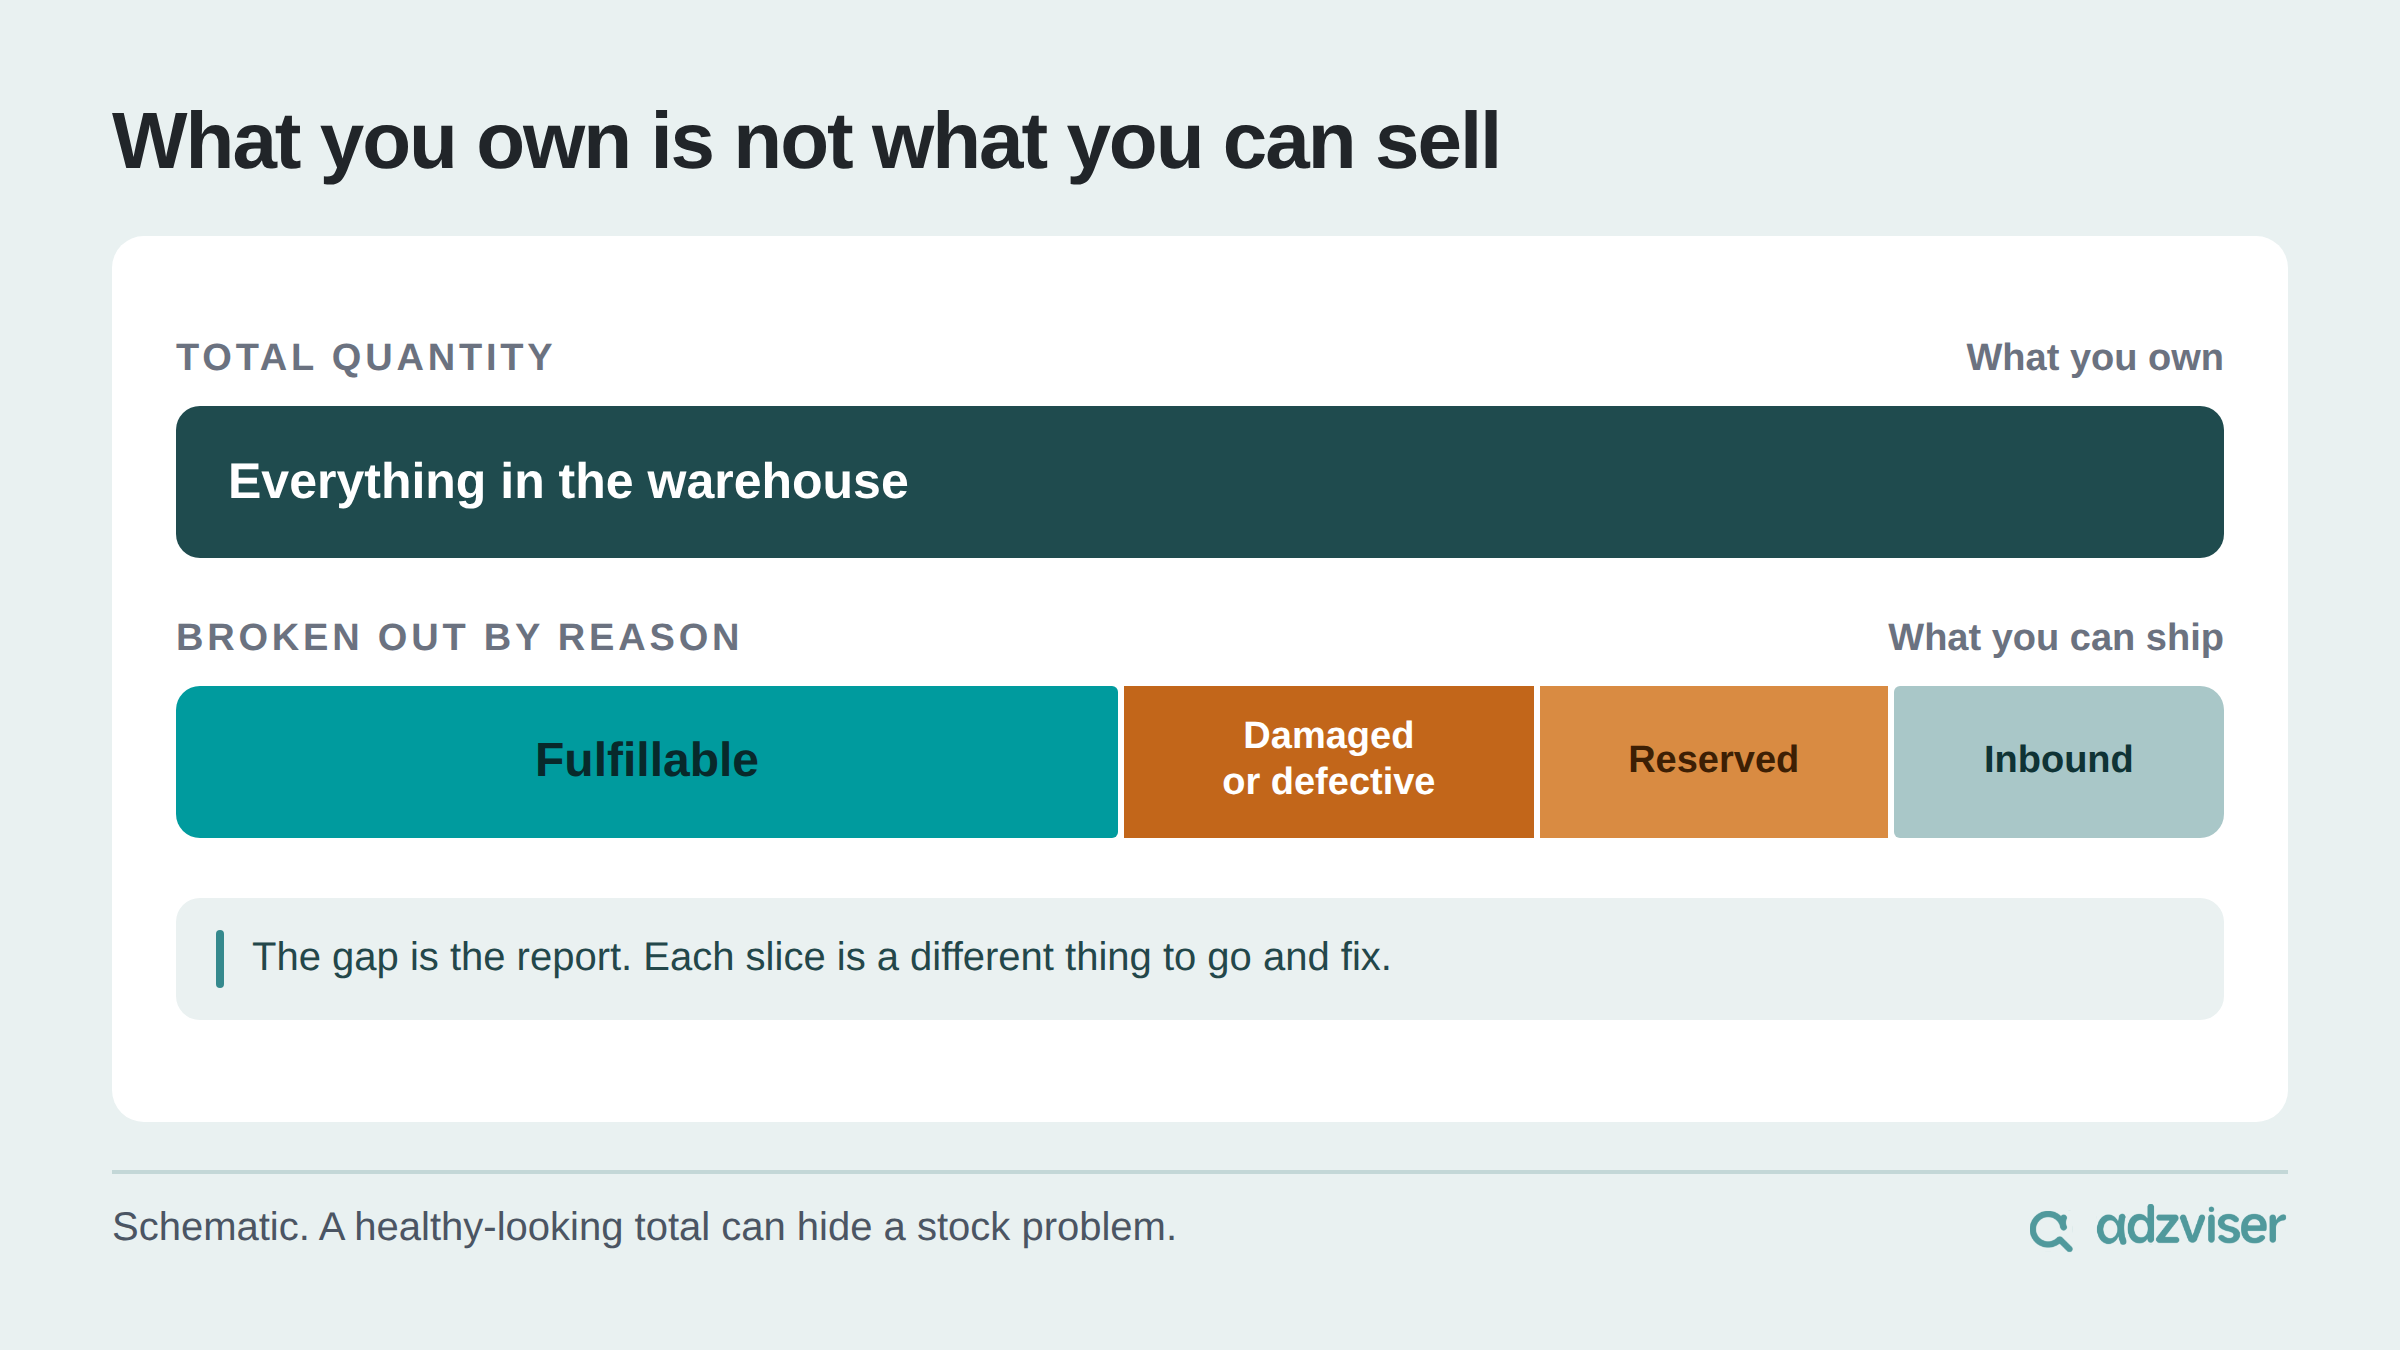
The useful part is the separation. Total quantity tells you what you own. Fulfillable quantity tells you what you can sell. The gap between them, broken out by reason, tells you what to fix.
Get the Amazon Seller Central Inventory template →
3. Google Merchant Center Overview report template
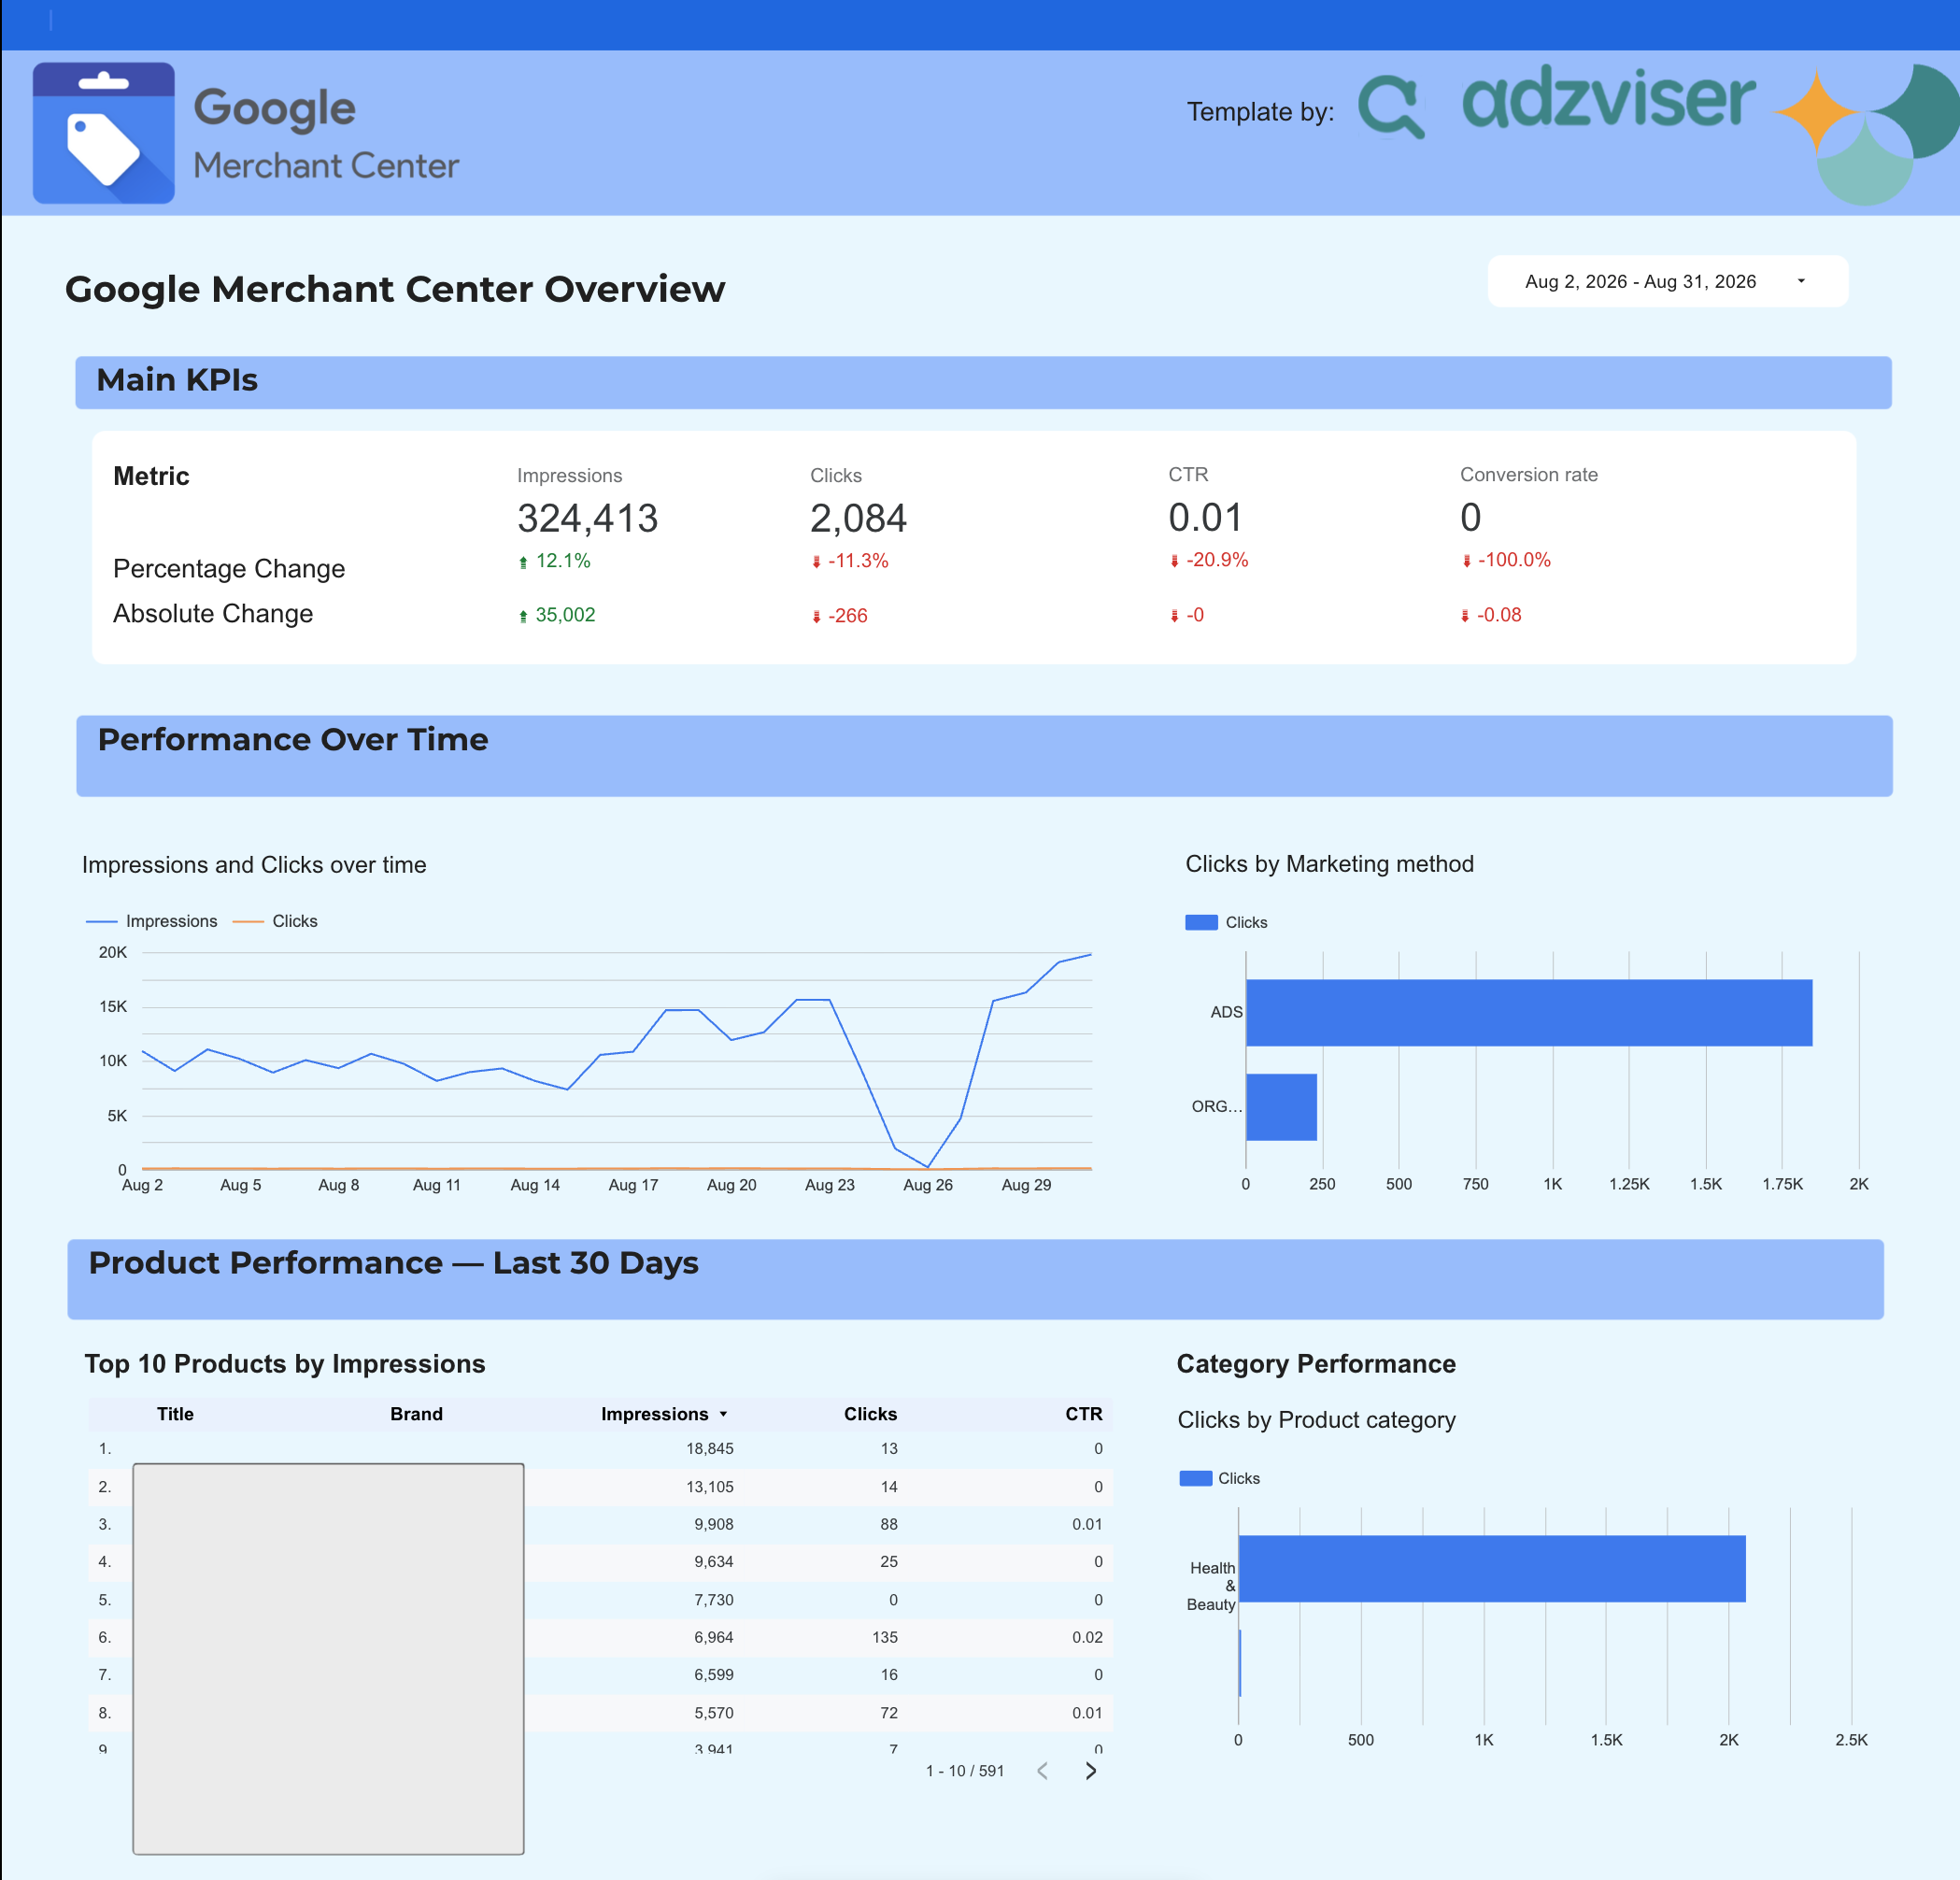
A two-page Data Studio template, the tool previously called Looker Studio, covering both product performance and feed health.
- Metrics: impressions, clicks, click through rate, conversion rate, total products, products with issues, issue occurrences
- Breakdowns: marketing method, product title, brand, product category, plus a dedicated feed health page for issue codes, severity levels, and affected attributes
- Answers: how performance is trending, which channels drive the most impressions, and where to focus optimization effort
The second page is the one that earns its keep. Feed issues sit next to performance data, so a drop in impressions and the disapproval that caused it show up in the same session. Local sellers can layer in Google My Business data alongside it.
Get the Google Merchant Center template →
Getting set up
Every template works the same way: start an Adzviser trial, connect your Shopify, Amazon Seller Central, or Merchant Center account, then copy the template. Adzviser replaces the sample data with your live numbers and refreshes them on demand or on whatever schedule you set.
The templates stay fully customizable. Add formulas, charts, or formatting however you like; just keep the underlying column names intact so the connection stays live.
What is ecommerce reporting?
At its simplest, ecommerce reporting means pulling the numbers that matter from your store, ads, inventory, and other systems into one place you can actually use.
A useful report usually covers three things:
- Demand: what people are searching for, clicking, and buying.
- Supply: what you have available to sell, where it sits, and whether it can actually ship.
- Outcome: revenue, margin, returns, and repeat purchases.
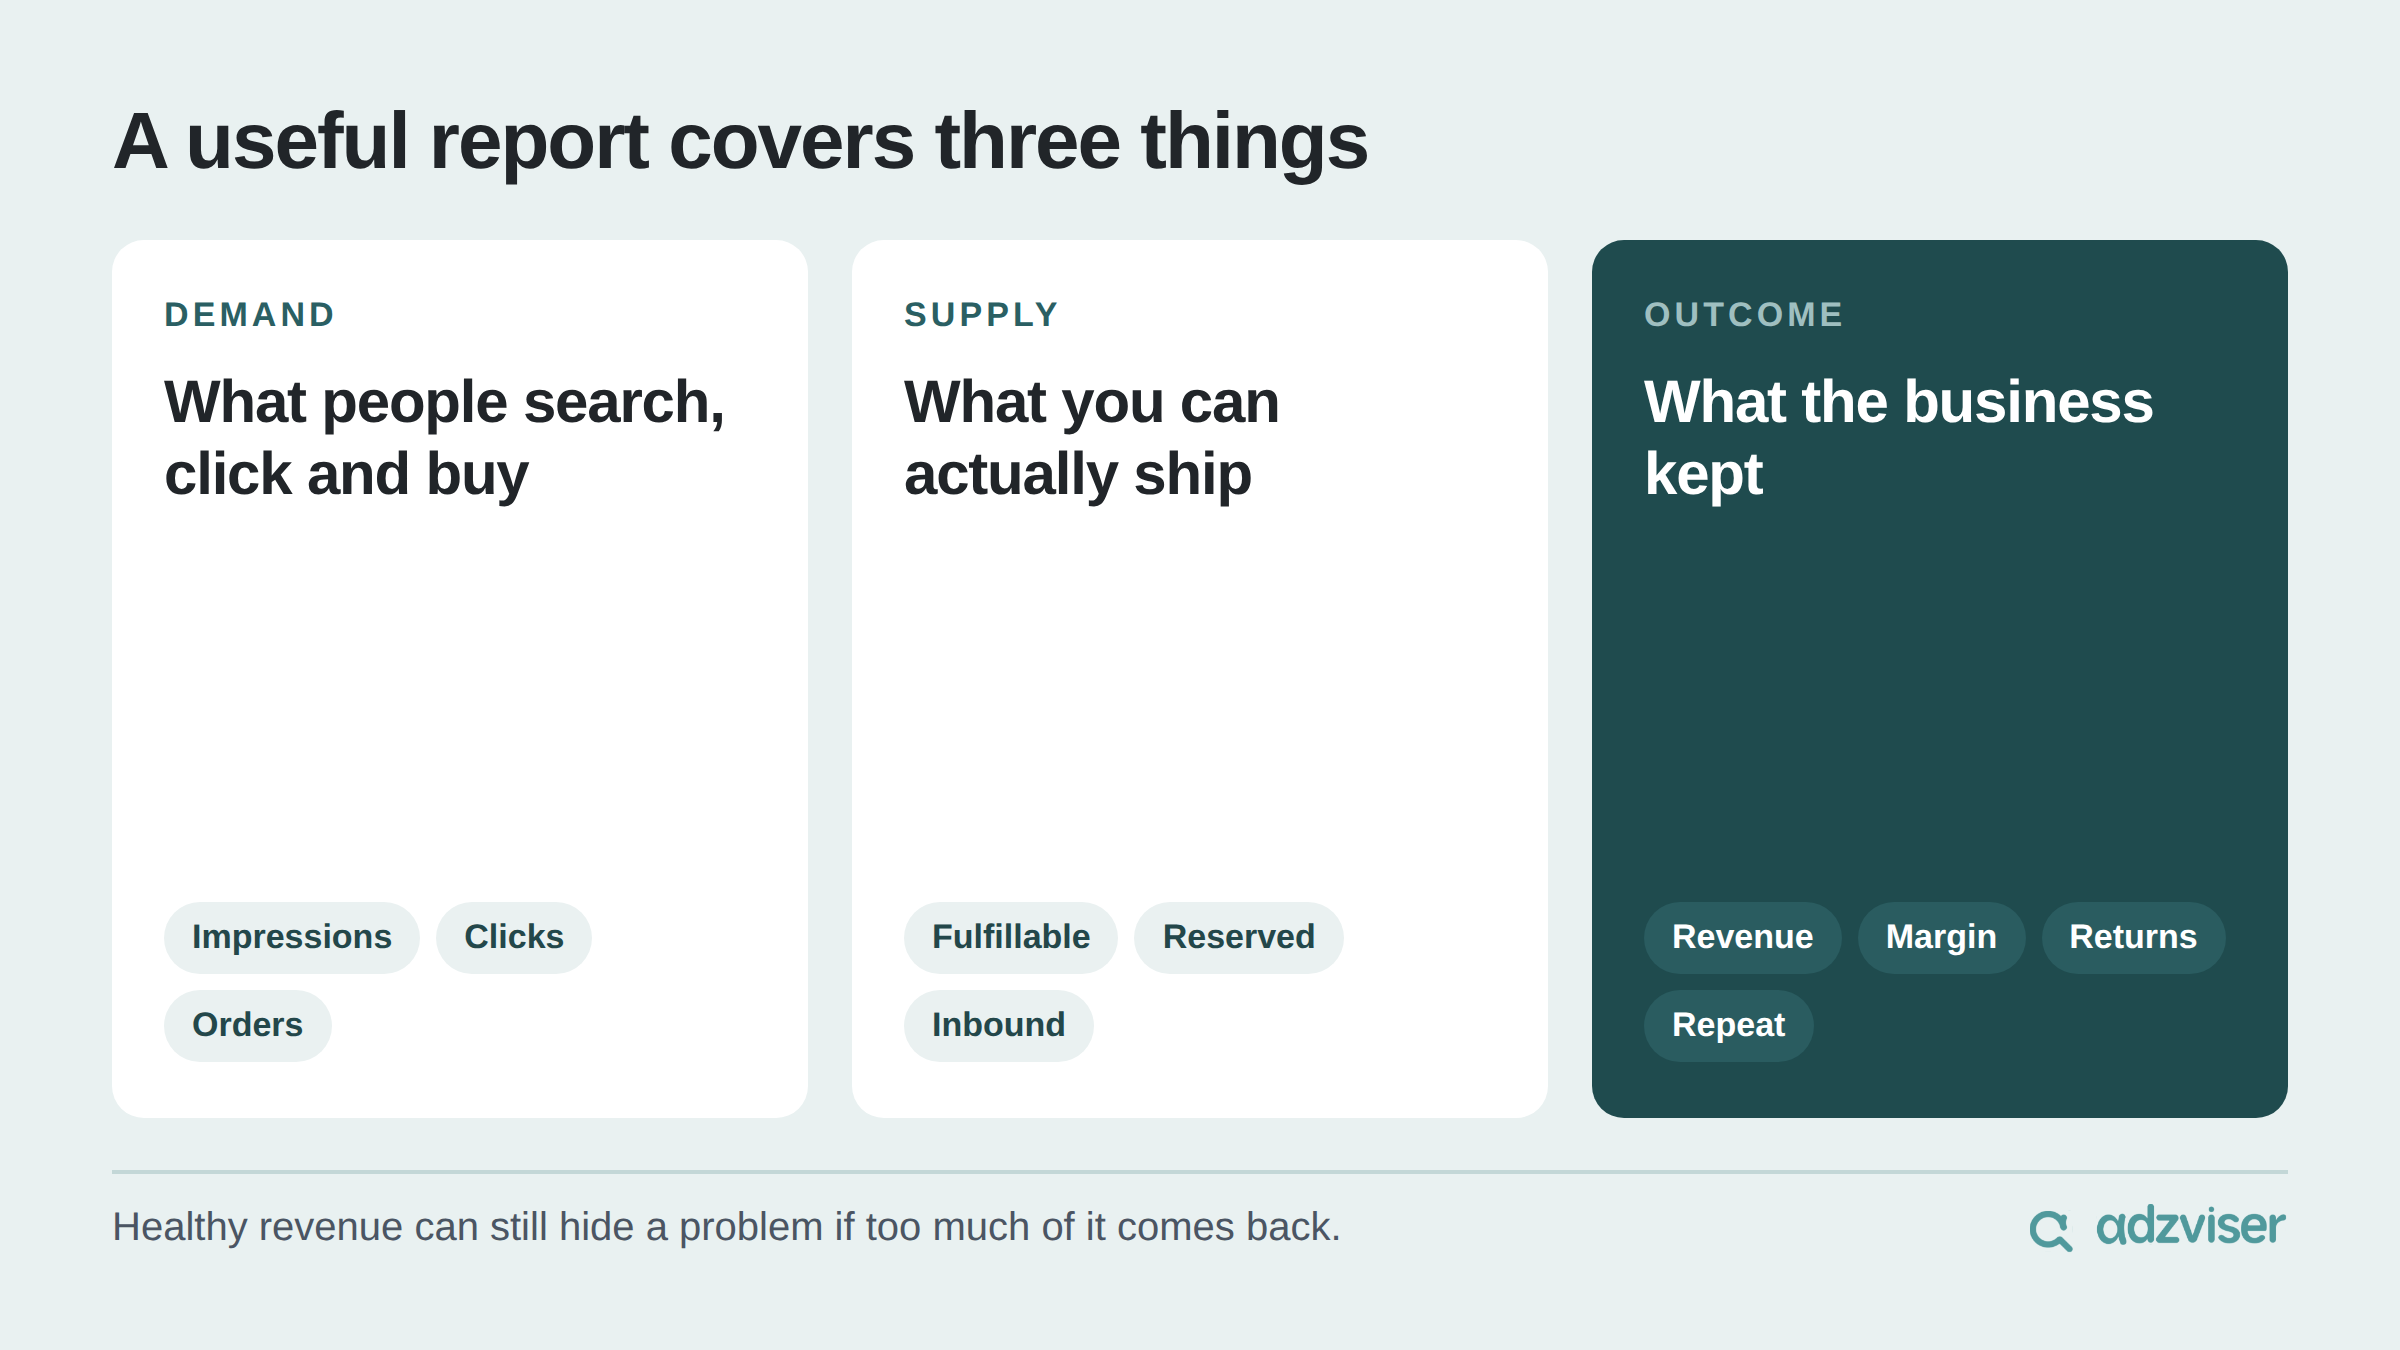
You need all three. Strong ad performance doesn't mean much if your best-selling product is about to run out of stock, and healthy revenue can hide a problem if too much of it comes back through returns.
What should an ecommerce report track?
You could measure hundreds of things. Most teams are better off tracking a short list consistently.
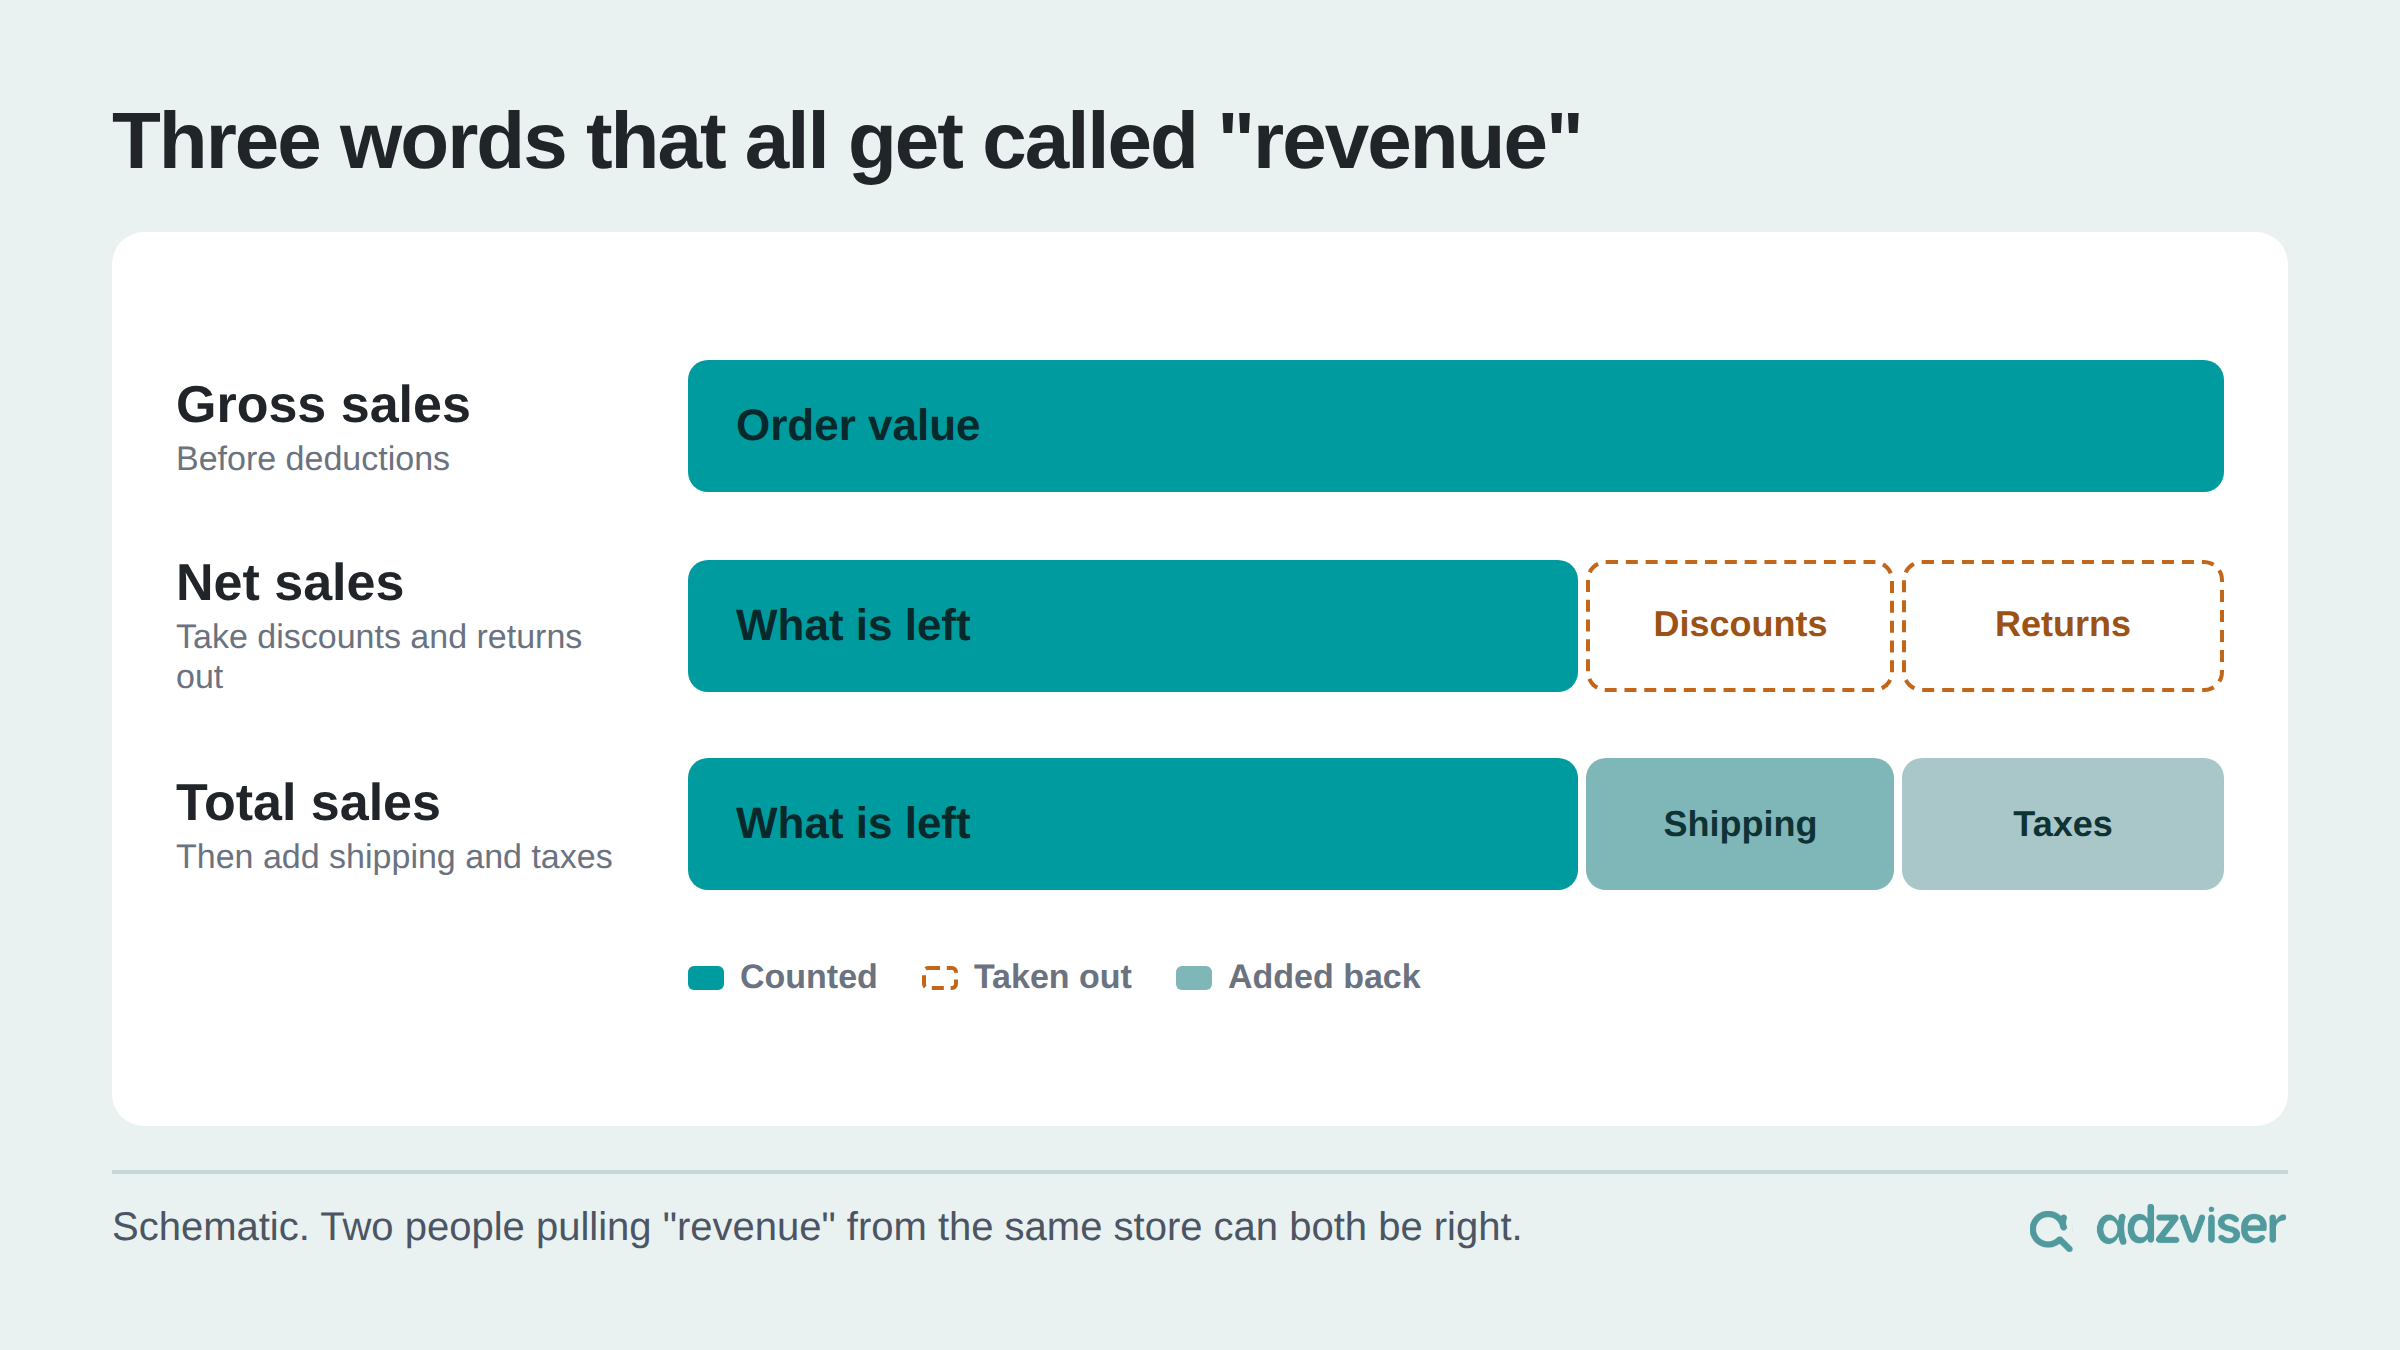
For sales, start with gross sales, net sales, total sales, orders, average order value, discounts, and returns. The important part is agreeing on what each number means. Gross sales is before deductions, net sales subtracts discounts and returns, and total sales adds shipping and taxes back in.
For inventory, focus on what you can actually sell. Fulfillable quantity matters more than total stock on hand. Keep an eye on unfulfillable, reserved, and inbound inventory so a healthy-looking total doesn't hide a stock problem.
For product and ad performance, impressions and clicks show reach and interest, while click-through rate and conversion rate show whether that attention turns into action. Feed health matters too: a disapproved product can simply stop appearing in ads and quietly drag down performance.
Where ecommerce reporting usually breaks down
The first problem is that data lives in different systems. Sales sit in your storefront, inventory sits somewhere else, and advertising data lives in another platform entirely. If someone has to copy those numbers into a spreadsheet every week, errors and delays are almost inevitable.
The second problem is inconsistent definitions and hidden operational issues. Two people can pull "revenue" from the same store and get different answers because one used gross sales and the other used net sales. Inventory creates the same problem when reserved or damaged units make stock levels look healthier than they are.
Then there's the problem we've seen repeatedly with customers: good reports get abandoned because they're annoying to refresh. Nobody wants to spend Monday morning pulling numbers from four platforms just to update the same spreadsheet again.
The fix across all three is similar: define your metrics once, keep related data in the same place, and automate as much of the collection and refresh process as possible.
Choosing the right ecommerce reporting tools
Most ecommerce teams end up using some combination of native platform reporting, spreadsheets, and connected reporting tools.
Native reporting is fine when you only need a quick look at one platform. Shopify Analytics, Seller Central, and Merchant Center already give you plenty of information inside their own ecosystems.
Spreadsheets remain popular because they're flexible, familiar, and easy to customize. Their weakness is keeping the data current.
Connected reporting tools solve that part by pulling data from your accounts into a spreadsheet or dashboard automatically. That's where Adzviser fits: you keep the reporting format you already use without having someone manually refresh it.
Where the data goes is up to you: Google Sheets, Power BI, or even Claude and ChatGPT for asking questions in plain language.
The right setup depends mostly on how many sources you're managing and how often you report. One platform once a month may be easy to handle manually. Several platforms every week is where automation starts paying for itself.
A few rules help regardless of the tools you choose: report on a consistent cadence, keep metric definitions in the report, remove charts nobody uses, and automate data collection before trying to automate the analysis.
Start with a template instead of a blank sheet
Reporting is much easier to maintain when you start with something already built and connected to your data.
Adzviser connects 50+ marketing, advertising, ecommerce, and CRM sources, including Klaviyo and Mailchimp for email and HubSpot and Salesforce for CRM.
Browse the full template gallery →
Not sure what to ask once your data is connected? Our AI prompt library has starting points for ecommerce reporting.
Ecommerce reporting FAQs
At minimum, include revenue with a clear definition, orders, average order value, a comparison against a previous period, and an important operational metric such as inventory or feed health.
Weekly is usually enough for sales and advertising performance. Fast-moving inventory may need daily updates.
Gross sales is order value before deductions. Net sales subtracts discounts and returns. Total sales adds shipping and taxes.
Yes. The main limitation is keeping the spreadsheet current, which is what a connected data source solves.
Not necessarily. In many cases, separate views for sales, inventory, and advertising are more useful than separate reports for every platform.
Hi! I am Zeyuan Gu. I am building easy-to-use and affordable data connectors for marketers. You can read about my journey and what I have learned along the way on this blog.